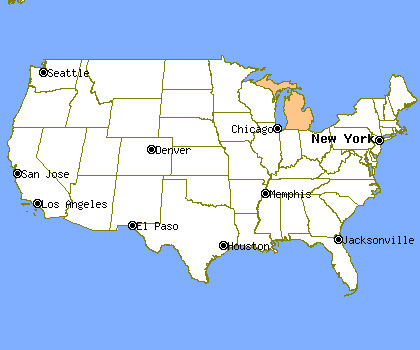
Michigan Profile
Total Population: 9,969,727
Capital: Lansing
Symbols
| State Flag |
|---|
 |
| State Seal |
|---|
 |
Population Statistics
Gender
| Population by Gender |
|---|
| Males | 49% |
| Females | 51% |
Race
| Population by Race |
|---|
| White | 80% |
| African American | 14% |
| Native American | 1% |
| Asian | 2% |
| Hawaiian | 0% |
| Other/Mixed | 3% |
Age
| Median Age |
|---|
| Population | 35.5 |
| Males | 34.3 |
| Females | 36.6 |
| Males by Age | Females by Age |
|---|
| Under 20 | 15% | | Under 20: | 14% |
| 20 to 40 | 14% | | 20 to 40: | 13% |
| 40 to 60 | 13% | | 40 to 60: | 14% |
| Over 60 | 7% | | Over 60: | 9% |
Size
| Population by Year | Annual Change |
|---|
| 2000 | 9,938,492 | N/A |
| 2001 | 10,006,093 | 0.68% |
| 2002 | 10,038,767 | 0.33% |
| 2003 | 10,066,351 | 0.27% |
| 2004 | 10,089,305 | 0.23% |
| 2005 | 10,090,554 | 0.01% |
| 2006 | 10,082,438 | -0.08% |
| 2007 | 10,050,847 | -0.31% |
| 2008 | 10,002,486 | -0.48% |
| 2009 | 9,969,727 | -0.33% |
Law Enforcement Statistics
Violent Crime Reports
| Rate Per 100K People |
|---|
| 2001 | 555 |
| 2002 | 540 |
| 2003 | 511 |
| 2004 | 490 |
| 2005 | 552 |
| 2006 | 562 |
| 2007 | 536 |
| 2008 | 501 |
| 2009 | 497 |
| 2010 | 490 |
| Vs. National Violent Crime Rate |
|---|
| Year |
Murder, Man-Slaughter |
Forcible Rape |
Robbery |
Aggravated Assault |
| 2001 |
672 | 5,264 | 12,937 | 36,551 |
| 2002 |
678 | 5,364 | 11,847 | 36,417 |
| 2003 |
617 | 5,451 | 11,257 | 34,199 |
| 2004 |
643 | 5,486 | 11,320 | 32,128 |
| 2005 |
616 | 5,193 | 13,342 | 36,726 |
| 2006 |
713 | 5,269 | 14,208 | 36,588 |
| 2007 |
676 | 4,579 | 13,414 | 35,319 |
| 2008 |
542 | 4,502 | 12,964 | 32,158 |
| 2009 |
627 | 4,514 | 12,330 | 32,076 |
| 2010 |
567 | 4,673 | 11,493 | 31,727 |
Property Crime Reports
| Rate Per 100K People |
|---|
| 2001 | 3,527 |
| 2002 | 3,334 |
| 2003 | 3,277 |
| 2004 | 3,058 |
| 2005 | 3,091 |
| 2006 | 3,213 |
| 2007 | 3,066 |
| 2008 | 2,935 |
| 2009 | 2,838 |
| 2010 | 2,714 |
| Vs. National Property Crime Rate |
|---|
| Year |
Burglary |
Larceny, Theft |
Motor Vehicle Theft |
| 2001 |
72,038 |
226,708 |
53,607 |
| 2002 |
70,970 |
214,367 |
49,723 |
| 2003 |
68,260 |
208,360 |
53,736 |
| 2004 |
64,394 |
194,259 |
50,555 |
| 2005 |
70,519 |
194,101 |
48,223 |
| 2006 |
76,107 |
198,227 |
50,017 |
| 2007 |
75,428 |
191,196 |
42,151 |
| 2008 |
74,176 |
183,168 |
36,241 |
| 2009 |
75,815 |
177,720 |
29,383 |
| 2010 |
73,868 |
166,980 |
27,353 |
Location

Cities & Towns
A
B
C
D
E
F
G
H
I
J
K
L
M
N
O
P
Q
R
S
T
U
V
W
Y
Z


