South Dakota Profile
Total Population: 812,383
Capital: Pierre
Symbols
| State Flag |
|---|
 |
| State Seal |
|---|
 |
Population Statistics
Gender
| Population by Gender |
|---|
| Males | 50% |
| Females | 50% |
Race
| Population by Race |
|---|
| White | 89% |
| African American | 1% |
| Native American | 8% |
| Asian | 1% |
| Hawaiian | 0% |
| Other/Mixed | 1% |
Age
| Median Age |
|---|
| Population | 35.6 |
| Males | 34.4 |
| Females | 36.7 |
| Males by Age | Females by Age |
|---|
| Under 20 | 15% | | Under 20: | 15% |
| 20 to 40 | 14% | | 20 to 40: | 12% |
| 40 to 60 | 13% | | 40 to 60: | 12% |
| Over 60 | 8% | | Over 60: | 10% |
Size
| Population by Year | Annual Change |
|---|
| 2000 | 754,835 | N/A |
| 2001 | 758,983 | 0.55% |
| 2002 | 762,107 | 0.41% |
| 2003 | 766,975 | 0.64% |
| 2004 | 774,283 | 0.95% |
| 2005 | 780,084 | 0.75% |
| 2006 | 788,519 | 1.08% |
| 2007 | 797,035 | 1.08% |
| 2008 | 804,532 | 0.94% |
| 2009 | 812,383 | 0.98% |
Law Enforcement Statistics
Violent Crime Reports
| Rate Per 100K People |
|---|
| 2001 | 155 |
| 2002 | 177 |
| 2003 | 173 |
| 2004 | 171 |
| 2005 | 176 |
| 2006 | 171 |
| 2007 | 169 |
| 2008 | 201 |
| 2009 | 186 |
| 2010 | 268 |
| Vs. National Violent Crime Rate |
|---|
| Year |
Murder, Man-Slaughter |
Forcible Rape |
Robbery |
Aggravated Assault |
| 2001 |
7 | 351 | 103 | 710 |
| 2002 |
11 | 361 | 117 | 861 |
| 2003 |
10 | 354 | 104 | 857 |
| 2004 |
18 | 338 | 114 | 852 |
| 2005 |
18 | 362 | 144 | 839 |
| 2006 |
9 | 336 | 119 | 876 |
| 2007 |
17 | 308 | 112 | 910 |
| 2008 |
26 | 432 | 120 | 1,042 |
| 2009 |
21 | 445 | 111 | 931 |
| 2010 |
23 | 390 | 154 | 1,619 |
Property Crime Reports
| Rate Per 100K People |
|---|
| 2001 | 2,177 |
| 2002 | 2,101 |
| 2003 | 2,002 |
| 2004 | 1,933 |
| 2005 | 1,776 |
| 2006 | 1,620 |
| 2007 | 1,652 |
| 2008 | 1,646 |
| 2009 | 1,719 |
| 2010 | 1,852 |
| Vs. National Property Crime Rate |
|---|
| Year |
Burglary |
Larceny, Theft |
Motor Vehicle Theft |
| 2001 |
3,087 |
12,571 |
815 |
| 2002 |
3,034 |
12,139 |
819 |
| 2003 |
2,873 |
11,552 |
874 |
| 2004 |
3,149 |
10,910 |
846 |
| 2005 |
2,517 |
10,426 |
841 |
| 2006 |
2,650 |
9,296 |
718 |
| 2007 |
2,378 |
10,043 |
735 |
| 2008 |
2,430 |
10,004 |
800 |
| 2009 |
2,479 |
10,676 |
813 |
| 2010 |
3,181 |
11,106 |
795 |
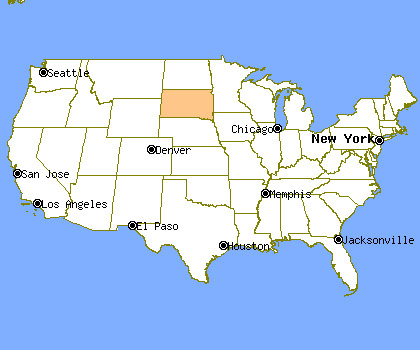
Location
Cities & Towns
A
B
C
D
E
F
G
H
I
J
K
L
M
N
O
P
Q
R
S
T
U
V
W
Y

