New Jersey Profile
Total Population: 8,707,739
Capital: Trenton
Symbols
| State Flag |
|---|
 |
| State Seal |
|---|
 |
Population Statistics
Gender
| Population by Gender |
|---|
| Males | 49% |
| Females | 51% |
Race
| Population by Race |
|---|
| White | 73% |
| African American | 14% |
| Native American | 0% |
| Asian | 6% |
| Hawaiian | 0% |
| Other/Mixed | 7% |
Age
| Median Age |
|---|
| Population | 36.7 |
| Males | 35.5 |
| Females | 38 |
| Males by Age | Females by Age |
|---|
| Under 20 | 14% | | Under 20: | 13% |
| 20 to 40 | 14% | | 20 to 40: | 14% |
| 40 to 60 | 13% | | 40 to 60: | 14% |
| Over 60 | 7% | | Over 60: | 10% |
Size
| Population by Year | Annual Change |
|---|
| 2000 | 8,414,378 | N/A |
| 2001 | 8,489,469 | 0.89% |
| 2002 | 8,544,115 | 0.64% |
| 2003 | 8,583,481 | 0.46% |
| 2004 | 8,611,530 | 0.33% |
| 2005 | 8,621,837 | 0.12% |
| 2006 | 8,623,721 | 0.02% |
| 2007 | 8,636,043 | 0.14% |
| 2008 | 8,663,398 | 0.32% |
| 2009 | 8,707,739 | 0.51% |
Law Enforcement Statistics
Violent Crime Reports
| Rate Per 100K People |
|---|
| 2001 | 390 |
| 2002 | 374 |
| 2003 | 366 |
| 2004 | 356 |
| 2005 | 355 |
| 2006 | 352 |
| 2007 | 329 |
| 2008 | 327 |
| 2009 | 311 |
| 2010 | 308 |
| Vs. National Violent Crime Rate |
|---|
| Year |
Murder, Man-Slaughter |
Forcible Rape |
Robbery |
Aggravated Assault |
| 2001 |
336 | 1,278 | 14,110 | 17,370 |
| 2002 |
337 | 1,347 | 13,905 | 16,579 |
| 2003 |
407 | 1,325 | 13,366 | 16,501 |
| 2004 |
392 | 1,331 | 13,076 | 16,144 |
| 2005 |
417 | 1,208 | 13,215 | 16,079 |
| 2006 |
428 | 1,237 | 13,357 | 15,650 |
| 2007 |
380 | 1,050 | 12,549 | 14,622 |
| 2008 |
376 | 1,122 | 12,701 | 14,152 |
| 2009 |
319 | 1,041 | 11,639 | 14,122 |
| 2010 |
371 | 981 | 11,818 | 13,885 |
Property Crime Reports
| Rate Per 100K People |
|---|
| 2001 | 2,835 |
| 2002 | 2,650 |
| 2003 | 2,544 |
| 2004 | 2,429 |
| 2005 | 2,333 |
| 2006 | 2,292 |
| 2007 | 2,213 |
| 2008 | 2,293 |
| 2009 | 2,080 |
| 2010 | 2,082 |
| Vs. National Property Crime Rate |
|---|
| Year |
Burglary |
Larceny, Theft |
Motor Vehicle Theft |
| 2001 |
46,812 |
156,031 |
37,708 |
| 2002 |
43,898 |
147,984 |
35,739 |
| 2003 |
43,453 |
141,778 |
34,568 |
| 2004 |
41,030 |
139,977 |
30,306 |
| 2005 |
38,980 |
136,728 |
27,683 |
| 2006 |
39,433 |
135,801 |
24,724 |
| 2007 |
37,482 |
132,791 |
21,953 |
| 2008 |
40,401 |
138,545 |
20,180 |
| 2009 |
37,262 |
128,327 |
15,508 |
| 2010 |
38,732 |
128,754 |
15,556 |
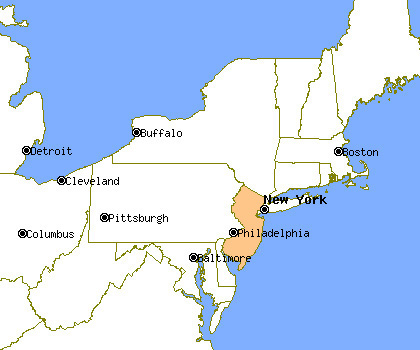
Location
Cities & Towns
A
B
C
D
E
F
G
H
I
J
K
L
M
N
O
P
R
S
T
U
V
W
Y

