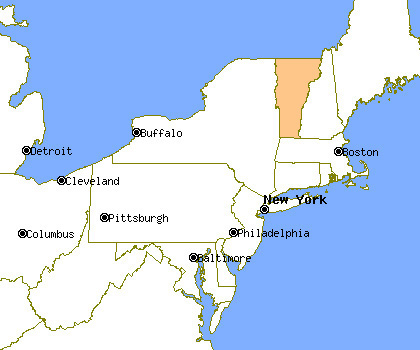
Vermont Profile
Total Population: 621,760
Capital: Montpelier
Symbols
| State Flag |
|---|
 |
| State Seal |
|---|
 |
Population Statistics
Gender
| Population by Gender |
|---|
| Males | 49% |
| Females | 51% |
Race
| Population by Race |
|---|
| White | 97% |
| African American | 1% |
| Native American | 0% |
| Asian | 1% |
| Hawaiian | 0% |
| Other/Mixed | 1% |
Age
| Median Age |
|---|
| Population | 37.7 |
| Males | 36.6 |
| Females | 38.7 |
| Males by Age | Females by Age |
|---|
| Under 20 | 14% | | Under 20: | 13% |
| 20 to 40 | 13% | | 20 to 40: | 13% |
| 40 to 60 | 15% | | 40 to 60: | 15% |
| Over 60 | 7% | | Over 60: | 9% |
Size
| Population by Year | Annual Change |
|---|
| 2000 | 608,821 | N/A |
| 2001 | 612,153 | 0.55% |
| 2002 | 614,950 | 0.46% |
| 2003 | 616,559 | 0.26% |
| 2004 | 618,145 | 0.26% |
| 2005 | 618,814 | 0.11% |
| 2006 | 619,985 | 0.19% |
| 2007 | 620,460 | 0.08% |
| 2008 | 621,049 | 0.09% |
| 2009 | 621,760 | 0.11% |
Law Enforcement Statistics
Violent Crime Reports
| Rate Per 100K People |
|---|
| 2001 | 105 |
| 2002 | 107 |
| 2003 | 110 |
| 2004 | 112 |
| 2005 | 120 |
| 2006 | 137 |
| 2007 | 124 |
| 2008 | 136 |
| 2009 | 131 |
| 2010 | 130 |
| Vs. National Violent Crime Rate |
|---|
| Year |
Murder, Man-Slaughter |
Forcible Rape |
Robbery |
Aggravated Assault |
| 2001 |
7 | 107 | 107 | 423 |
| 2002 |
13 | 126 | 77 | 442 |
| 2003 |
14 | 121 | 60 | 487 |
| 2004 |
16 | 152 | 76 | 452 |
| 2005 |
8 | 145 | 73 | 520 |
| 2006 |
12 | 150 | 110 | 580 |
| 2007 |
12 | 123 | 80 | 557 |
| 2008 |
17 | 127 | 89 | 611 |
| 2009 |
7 | 124 | 111 | 575 |
| 2010 |
7 | 132 | 74 | 602 |
Property Crime Reports
| Rate Per 100K People |
|---|
| 2001 | 2,664 |
| 2002 | 2,423 |
| 2003 | 2,200 |
| 2004 | 2,308 |
| 2005 | 2,281 |
| 2006 | 2,305 |
| 2007 | 2,323 |
| 2008 | 2,539 |
| 2009 | 2,401 |
| 2010 | 2,282 |
| Vs. National Property Crime Rate |
|---|
| Year |
Burglary |
Larceny, Theft |
Motor Vehicle Theft |
| 2001 |
3,150 |
12,426 |
758 |
| 2002 |
3,489 |
10,684 |
769 |
| 2003 |
2,958 |
10,017 |
646 |
| 2004 |
3,386 |
10,382 |
575 |
| 2005 |
3,064 |
10,505 |
641 |
| 2006 |
3,300 |
10,493 |
586 |
| 2007 |
3,106 |
10,683 |
641 |
| 2008 |
3,462 |
11,724 |
585 |
| 2009 |
3,452 |
11,031 |
448 |
| 2010 |
3,366 |
10,474 |
441 |
Location
Cities & Towns
A
B
C
D
E
F
G
H
I
J
L
M
N
O
P
R
S
V
W

