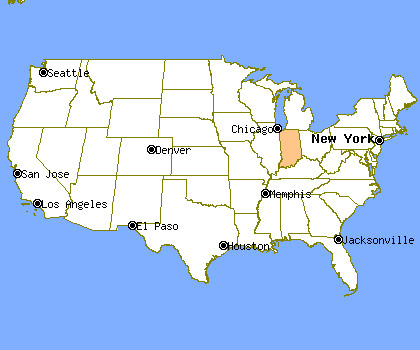
Indiana Profile
Total Population: 6,423,113
Capital: Indianapolis
Symbols
| State Flag |
|---|
 |
| State Seal |
|---|
 |
Population Statistics
Gender
| Population by Gender |
|---|
| Males | 49% |
| Females | 51% |
Race
| Population by Race |
|---|
| White | 87% |
| African American | 8% |
| Native American | 0% |
| Asian | 1% |
| Hawaiian | 0% |
| Other/Mixed | 4% |
Age
| Median Age |
|---|
| Population | 35.2 |
| Males | 33.9 |
| Females | 36.5 |
| Males by Age | Females by Age |
|---|
| Under 20 | 15% | | Under 20: | 14% |
| 20 to 40 | 14% | | 20 to 40: | 13% |
| 40 to 60 | 13% | | 40 to 60: | 13% |
| Over 60 | 7% | | Over 60: | 9% |
Size
| Population by Year | Annual Change |
|---|
| 2000 | 6,080,520 | N/A |
| 2001 | 6,124,967 | 0.73% |
| 2002 | 6,149,007 | 0.39% |
| 2003 | 6,181,789 | 0.53% |
| 2004 | 6,214,454 | 0.53% |
| 2005 | 6,253,120 | 0.62% |
| 2006 | 6,301,700 | 0.78% |
| 2007 | 6,346,113 | 0.70% |
| 2008 | 6,388,309 | 0.66% |
| 2009 | 6,423,113 | 0.54% |
Law Enforcement Statistics
Violent Crime Reports
| Rate Per 100K People |
|---|
| 2001 | 372 |
| 2002 | 357 |
| 2003 | 353 |
| 2004 | 325 |
| 2005 | 324 |
| 2006 | 315 |
| 2007 | 334 |
| 2008 | 334 |
| 2009 | 333 |
| 2010 | 314 |
| Vs. National Violent Crime Rate |
|---|
| Year |
Murder, Man-Slaughter |
Forcible Rape |
Robbery |
Aggravated Assault |
| 2001 |
413 | 1,716 | 7,171 | 13,434 |
| 2002 |
362 | 1,843 | 6,612 | 13,184 |
| 2003 |
341 | 1,720 | 6,403 | 13,392 |
| 2004 |
316 | 1,803 | 6,373 | 11,802 |
| 2005 |
356 | 1,856 | 6,809 | 11,281 |
| 2006 |
369 | 1,835 | 7,243 | 10,429 |
| 2007 |
356 | 1,742 | 7,872 | 11,195 |
| 2008 |
327 | 1,720 | 7,532 | 11,704 |
| 2009 |
310 | 1,640 | 7,352 | 12,102 |
| 2010 |
292 | 1,761 | 6,219 | 12,117 |
Property Crime Reports
| Rate Per 100K People |
|---|
| 2001 | 3,460 |
| 2002 | 3,393 |
| 2003 | 3,358 |
| 2004 | 3,398 |
| 2005 | 3,456 |
| 2006 | 3,502 |
| 2007 | 3,397 |
| 2008 | 3,336 |
| 2009 | 3,116 |
| 2010 | 3,042 |
| Vs. National Property Crime Rate |
|---|
| Year |
Burglary |
Larceny, Theft |
Motor Vehicle Theft |
| 2001 |
42,758 |
147,291 |
21,499 |
| 2002 |
42,605 |
146,073 |
20,287 |
| 2003 |
41,581 |
145,685 |
20,768 |
| 2004 |
42,168 |
148,670 |
21,091 |
| 2005 |
43,756 |
151,278 |
21,744 |
| 2006 |
46,168 |
153,093 |
21,866 |
| 2007 |
46,919 |
149,050 |
19,557 |
| 2008 |
48,645 |
146,615 |
17,455 |
| 2009 |
48,910 |
137,371 |
13,879 |
| 2010 |
47,115 |
137,027 |
13,118 |
Location

Cities & Towns
A
B
C
D
E
F
G
H
I
J
K
L
M
N
O
P
R
S
T
U
V
W
Y
Z


