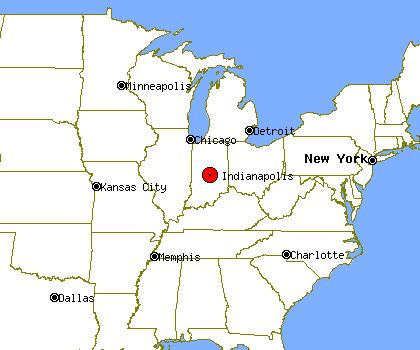
Indianapolis, IN Profile
Indianapolis, IN, population 807,584, is located
in Indiana's Marion county,
about 100.0 miles from Cincinnati and 104.5 miles from Dayton.
It is estimated that in the first 5 years of the past decade the population of Indianapolis has stayed about the same. Since 2005 Indianapolis's population has grown by about 2%.
Indianapolis's property crime levels tend to be higher than Indiana's average level.
The same data shows violent crime levels in Indianapolis tend to be much higher than Indiana's average level.
Population Statistics
Gender
| Population by Gender |
|---|
| Males | 48% |
| Females | 52% |
Race
| Population by Race |
|---|
| White | 69% |
| African American | 26% |
| Native American | 0% |
| Asian | 1% |
| Hawaiian | 0% |
| Other/Mixed | 4% |
Age
| Median Age |
|---|
| Population | 9.99 |
| Males | 9.99 |
| Females | 9.99 |
| Males by Age | Females by Age |
|---|
| Under 20 | 9.99% | | Under 20: | 9.99% |
| 20 to 40 | 9.99% | | 20 to 40: | 9.99% |
| 40 to 60 | 9.99% | | 40 to 60: | 9.99% |
| Over 60 | 6.00% | | Over 60: | 9.00% |
Size
| Population by Year | Change Rate |
|---|
| 2000 | 781,867 | N/A |
| 2001 | 785,672 | 0.49% |
| 2002 | 785,142 | -0.07% |
| 2003 | 786,235 | 0.14% |
| 2004 | 787,198 | 0.12% |
| 2005 | 789,250 | 0.26% |
| 2006 | 792,619 | 0.43% |
| 2007 | 796,611 | 0.50% |
| 2008 | 800,730 | 0.52% |
| 2009 | 807,584 | 0.86% |
Economics
| Household Income |
|---|
| Median | $40,051 |
Law Enforcement Statistics
Violent Crime Reports
| Rate Per 100K People |
|---|
| 2001 | 931 |
| 2002 | 935 |
| 2003 | 883 |
| 2004 | 883 |
| 2005 | 993 |
| 2006 | 960 |
| 2007 | 1,234 |
| 2008 | 1,204 |
| 2009 | 1,200 |
| 2010 | N/A |
| Vs. State Violent Crime Rate |
|---|
| Year |
Murder, Man-Slaughter |
Forcible Rape |
Robbery |
Aggravated Assault |
| 2001 |
112 | 442 | 2,787 | 4,087 |
| 2002 |
112 | 441 | 2,937 | 4,028 |
| 2003 |
107 | 420 | 2,828 | 3,714 |
| 2004 |
109 | 479 | 2,763 | 3,716 |
| 2005 |
108 | 527 | 3,274 | 4,039 |
| 2006 |
140 | 549 | 3249 | 3751 |
| 2007 |
114 | 505 | 4046 | 5176 |
| 2008 |
114 | 475 | 4023 | 5123 |
| 2009 |
100 | 460 | 3929 | 5271 |
| 2010 |
- | - | - | - |
Property Crime Reports
| Rate Per 100K People |
|---|
| 2001 | 4,213 |
| 2002 | 5,097 |
| 2003 | 5,672 |
| 2004 | 5,870 |
| 2005 | 6,258 |
| 2006 | 6,192 |
| 2007 | 6,308 |
| 2008 | 6,084 |
| 2009 | 5,829 |
| 2010 | N/A |
| Vs. State Property Crime Rate |
|---|
| Year |
Burglary |
Larceny, Theft |
Motor Vehicle Theft |
| 2001 |
9,043 |
18,224 |
6,363 |
| 2002 |
9,662 |
24,821 |
6,502 |
| 2003 |
10,062 |
27,891 |
7,433 |
| 2004 |
10,920 |
28,364 |
7,714 |
| 2005 |
11,548 |
29,541 |
8,992 |
| 2006 |
11734 |
28929 |
8936 |
| 2007 |
13385 |
29224 |
7680 |
| 2008 |
14267 |
28466 |
6444 |
| 2009 |
15217 |
27717 |
4485 |
| 2010 |
- |
- |
- |
Location
| Elevation | 717 feet above sea level |


