Hawaii Profile
Total Population: 1,295,178
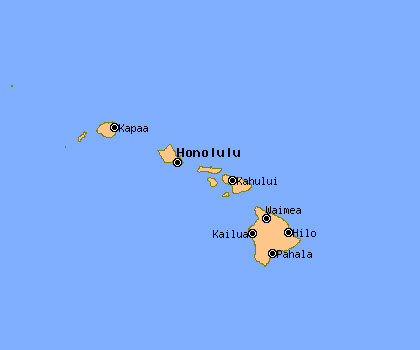
Capital: Honolulu
Symbols
| State Flag |
|---|
 |
| State Seal |
|---|
 |
Population Statistics
Gender
| Population by Gender |
|---|
| Males | 50% |
| Females | 50% |
Race
| Population by Race |
|---|
| White | 24% |
| African American | 2% |
| Native American | 0% |
| Asian | 42% |
| Hawaiian | 9% |
| Other/Mixed | 23% |
Age
| Median Age |
|---|
| Population | 36.2 |
| Males | 35.1 |
| Females | 37.4 |
| Males by Age | Females by Age |
|---|
| Under 20 | 14% | | Under 20: | 13% |
| 20 to 40 | 15% | | 20 to 40: | 13% |
| 40 to 60 | 13% | | 40 to 60: | 13% |
| Over 60 | 8% | | Over 60: | 9% |
Size
| Population by Year | Annual Change |
|---|
| 2000 | 1,211,538 | N/A |
| 2001 | 1,218,305 | 0.56% |
| 2002 | 1,228,069 | 0.80% |
| 2003 | 1,239,298 | 0.91% |
| 2004 | 1,252,782 | 1.09% |
| 2005 | 1,266,117 | 1.06% |
| 2006 | 1,275,599 | 0.75% |
| 2007 | 1,276,832 | 0.10% |
| 2008 | 1,287,481 | 0.83% |
| 2009 | 1,295,178 | 0.60% |
Law Enforcement Statistics
Violent Crime Reports
| Rate Per 100K People |
|---|
| 2001 | 255 |
| 2002 | 262 |
| 2003 | 270 |
| 2004 | 254 |
| 2005 | 255 |
| 2006 | 281 |
| 2007 | 273 |
| 2008 | 273 |
| 2009 | 275 |
| 2010 | 263 |
| Vs. National Violent Crime Rate |
|---|
| Year |
Murder, Man-Slaughter |
Forcible Rape |
Robbery |
Aggravated Assault |
| 2001 |
32 | 409 | 1,142 | 1,534 |
| 2002 |
24 | 372 | 1,210 | 1,656 |
| 2003 |
22 | 367 | 1,168 | 1,843 |
| 2004 |
33 | 333 | 944 | 1,903 |
| 2005 |
24 | 343 | 1,001 | 1,885 |
| 2006 |
21 | 355 | 1,143 | 2,096 |
| 2007 |
22 | 326 | 1,105 | 2,048 |
| 2008 |
25 | 365 | 1,086 | 2,036 |
| 2009 |
22 | 392 | 1,034 | 2,111 |
| 2010 |
24 | 365 | 1,054 | 2,131 |
Property Crime Reports
| Rate Per 100K People |
|---|
| 2001 | 5,132 |
| 2002 | 5,782 |
| 2003 | 5,237 |
| 2004 | 4,793 |
| 2005 | 4,793 |
| 2006 | 4,230 |
| 2007 | 4,225 |
| 2008 | 3,571 |
| 2009 | 3,661 |
| 2010 | 3,314 |
| Vs. National Property Crime Rate |
|---|
| Year |
Burglary |
Larceny, Theft |
Motor Vehicle Theft |
| 2001 |
11,162 |
44,925 |
6,743 |
| 2002 |
12,722 |
49,344 |
9,910 |
| 2003 |
11,409 |
44,807 |
9,651 |
| 2004 |
10,827 |
41,078 |
8,620 |
| 2005 |
9,792 |
42,188 |
9,135 |
| 2006 |
8,709 |
37,910 |
7,763 |
| 2007 |
9,097 |
38,416 |
6,715 |
| 2008 |
9,379 |
31,492 |
5,133 |
| 2009 |
9,178 |
33,422 |
4,819 |
| 2010 |
8,663 |
31,320 |
5,100 |
Location
Cities & Towns
A
C
E
F
H
K
L
M
N
O
P
V
W

