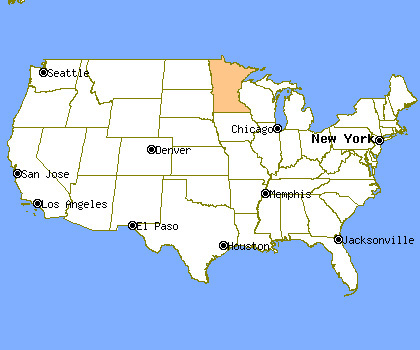
Minnesota Profile
Total Population: 5,266,214
Capital: St. Paul
Symbols
| State Flag |
|---|
 |
| State Seal |
|---|
 |
Population Statistics
Gender
| Population by Gender |
|---|
| Males | 50% |
| Females | 50% |
Race
| Population by Race |
|---|
| White | 89% |
| African American | 3% |
| Native American | 1% |
| Asian | 3% |
| Hawaiian | 0% |
| Other/Mixed | 4% |
Age
| Median Age |
|---|
| Population | 35.4 |
| Males | 34.4 |
| Females | 36.3 |
| Males by Age | Females by Age |
|---|
| Under 20 | 15% | | Under 20: | 14% |
| 20 to 40 | 14% | | 20 to 40: | 13% |
| 40 to 60 | 13% | | 40 to 60: | 13% |
| Over 60 | 7% | | Over 60: | 9% |
Size
| Population by Year | Annual Change |
|---|
| 2000 | 4,919,492 | N/A |
| 2001 | 4,982,813 | 1.29% |
| 2002 | 5,017,458 | 0.70% |
| 2003 | 5,047,862 | 0.61% |
| 2004 | 5,079,344 | 0.62% |
| 2005 | 5,106,560 | 0.54% |
| 2006 | 5,148,346 | 0.82% |
| 2007 | 5,191,206 | 0.83% |
| 2008 | 5,230,567 | 0.76% |
| 2009 | 5,266,214 | 0.68% |
Law Enforcement Statistics
Violent Crime Reports
| Rate Per 100K People |
|---|
| 2001 | 264 |
| 2002 | 268 |
| 2003 | 263 |
| 2004 | 270 |
| 2005 | 297 |
| 2006 | 312 |
| 2007 | 289 |
| 2008 | 263 |
| 2009 | 244 |
| 2010 | 236 |
| Vs. National Violent Crime Rate |
|---|
| Year |
Murder, Man-Slaughter |
Forcible Rape |
Robbery |
Aggravated Assault |
| 2001 |
119 | 2,236 | 3,758 | 7,032 |
| 2002 |
112 | 2,273 | 3,937 | 7,106 |
| 2003 |
128 | 2,083 | 3,904 | 7,173 |
| 2004 |
113 | 2,123 | 4,070 | 7,445 |
| 2005 |
115 | 2,258 | 4,724 | 8,146 |
| 2006 |
125 | 1,645 | 5,433 | 8,920 |
| 2007 |
116 | 1,873 | 4,770 | 8,244 |
| 2008 |
109 | 1,805 | 4,177 | 7,626 |
| 2009 |
74 | 1,789 | 3,619 | 7,360 |
| 2010 |
96 | 1,798 | 3,388 | 7,233 |
Property Crime Reports
| Rate Per 100K People |
|---|
| 2001 | 3,319 |
| 2002 | 3,268 |
| 2003 | 3,117 |
| 2004 | 3,039 |
| 2005 | 3,084 |
| 2006 | 3,079 |
| 2007 | 3,037 |
| 2008 | 2,851 |
| 2009 | 2,641 |
| 2010 | 2,572 |
| Vs. National Property Crime Rate |
|---|
| Year |
Burglary |
Larceny, Theft |
Motor Vehicle Theft |
| 2001 |
25,496 |
124,519 |
15,031 |
| 2002 |
28,034 |
122,150 |
13,842 |
| 2003 |
27,696 |
116,236 |
13,759 |
| 2004 |
28,048 |
113,453 |
13,518 |
| 2005 |
29,716 |
114,304 |
14,281 |
| 2006 |
30,173 |
115,567 |
13,379 |
| 2007 |
29,670 |
115,633 |
12,526 |
| 2008 |
26,410 |
112,322 |
10,078 |
| 2009 |
25,488 |
105,076 |
8,519 |
| 2010 |
24,415 |
103,429 |
8,587 |
Location

Cities & Towns
A
B
C
D
E
F
G
H
I
J
K
L
M
N
O
P
Q
R
S
T
U
V
W
Z


