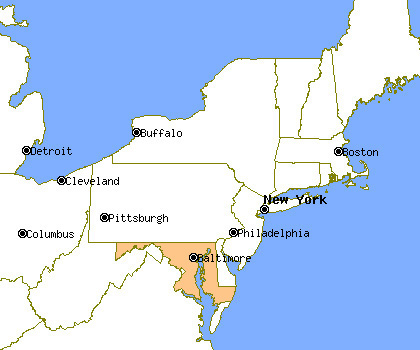
Maryland Profile
Total Population: 5,699,478
Capital: Annapolis
Symbols
| State Flag |
|---|
 |
| State Seal |
|---|
 |
Population Statistics
Gender
| Population by Gender |
|---|
| Males | 48% |
| Females | 52% |
Race
| Population by Race |
|---|
| White | 64% |
| African American | 28% |
| Native American | 0% |
| Asian | 4% |
| Hawaiian | 0% |
| Other/Mixed | 4% |
Age
| Median Age |
|---|
| Population | 36 |
| Males | 34.9 |
| Females | 37 |
| Males by Age | Females by Age |
|---|
| Under 20 | 14% | | Under 20: | 14% |
| 20 to 40 | 14% | | 20 to 40: | 14% |
| 40 to 60 | 13% | | 40 to 60: | 14% |
| Over 60 | 6% | | Over 60: | 9% |
Size
| Population by Year | Annual Change |
|---|
| 2000 | 5,296,544 | N/A |
| 2001 | 5,375,033 | 1.48% |
| 2002 | 5,439,913 | 1.21% |
| 2003 | 5,496,708 | 1.04% |
| 2004 | 5,542,659 | 0.84% |
| 2005 | 5,582,520 | 0.72% |
| 2006 | 5,612,196 | 0.53% |
| 2007 | 5,634,242 | 0.39% |
| 2008 | 5,658,655 | 0.43% |
| 2009 | 5,699,478 | 0.72% |
Law Enforcement Statistics
Violent Crime Reports
| Rate Per 100K People |
|---|
| 2001 | 783 |
| 2002 | 770 |
| 2003 | 704 |
| 2004 | 700 |
| 2005 | 703 |
| 2006 | 679 |
| 2007 | 642 |
| 2008 | 628 |
| 2009 | 590 |
| 2010 | 548 |
| Vs. National Violent Crime Rate |
|---|
| Year |
Murder, Man-Slaughter |
Forcible Rape |
Robbery |
Aggravated Assault |
| 2001 |
446 | 1,449 | 13,525 | 26,668 |
| 2002 |
513 | 1,370 | 13,417 | 26,715 |
| 2003 |
525 | 1,358 | 13,302 | 23,593 |
| 2004 |
521 | 1,316 | 12,761 | 24,334 |
| 2005 |
552 | 1,266 | 14,378 | 23,173 |
| 2006 |
546 | 1,178 | 14,375 | 22,011 |
| 2007 |
553 | 1,179 | 13,258 | 21,072 |
| 2008 |
493 | 1,127 | 13,203 | 20,570 |
| 2009 |
438 | 1,156 | 12,007 | 20,022 |
| 2010 |
430 | 1,227 | 11,054 | 18,909 |
Property Crime Reports
| Rate Per 100K People |
|---|
| 2001 | 4,084 |
| 2002 | 3,978 |
| 2003 | 3,801 |
| 2004 | 3,640 |
| 2005 | 3,544 |
| 2006 | 3,481 |
| 2007 | 3,432 |
| 2008 | 3,518 |
| 2009 | 3,201 |
| 2010 | 2,997 |
| Vs. National Property Crime Rate |
|---|
| Year |
Burglary |
Larceny, Theft |
Motor Vehicle Theft |
| 2001 |
41,553 |
145,934 |
32,025 |
| 2002 |
39,765 |
143,320 |
34,020 |
| 2003 |
38,641 |
134,372 |
36,405 |
| 2004 |
36,682 |
129,786 |
35,858 |
| 2005 |
35,922 |
128,491 |
34,070 |
| 2006 |
37,457 |
127,497 |
30,522 |
| 2007 |
37,095 |
127,308 |
28,393 |
| 2008 |
38,849 |
133,983 |
25,333 |
| 2009 |
37,032 |
125,771 |
19,619 |
| 2010 |
36,542 |
118,458 |
18,051 |
Location

Cities & Towns
A
B
C
D
E
F
G
H
I
J
K
L
M
N
O
P
Q
R
S
T
U
V
W


