Virginia Profile
Total Population: 7,882,590
Capital: Richmond
Symbols
| State Flag |
|---|
 |
| State Seal |
|---|
 |
Population Statistics
Gender
| Population by Gender |
|---|
| Males | 49% |
| Females | 51% |
Race
| Population by Race |
|---|
| White | 72% |
| African American | 20% |
| Native American | 0% |
| Asian | 4% |
| Hawaiian | 0% |
| Other/Mixed | 4% |
Age
| Median Age |
|---|
| Population | 35.7 |
| Males | 34.5 |
| Females | 36.8 |
| Males by Age | Females by Age |
|---|
| Under 20 | 14% | | Under 20: | 13% |
| 20 to 40 | 15% | | 20 to 40: | 14% |
| 40 to 60 | 13% | | 40 to 60: | 14% |
| Over 60 | 6% | | Over 60: | 9% |
Size
| Population by Year | Annual Change |
|---|
| 2000 | 7,079,048 | N/A |
| 2001 | 7,191,304 | 1.59% |
| 2002 | 7,283,541 | 1.28% |
| 2003 | 7,373,694 | 1.24% |
| 2004 | 7,468,914 | 1.29% |
| 2005 | 7,563,887 | 1.27% |
| 2006 | 7,646,996 | 1.10% |
| 2007 | 7,719,749 | 0.95% |
| 2008 | 7,795,424 | 0.98% |
| 2009 | 7,882,590 | 1.12% |
Law Enforcement Statistics
Violent Crime Reports
| Rate Per 100K People |
|---|
| 2001 | 291 |
| 2002 | 291 |
| 2003 | 276 |
| 2004 | 276 |
| 2005 | 283 |
| 2006 | 282 |
| 2007 | 270 |
| 2008 | 256 |
| 2009 | 227 |
| 2010 | 214 |
| Vs. National Violent Crime Rate |
|---|
| Year |
Murder, Man-Slaughter |
Forcible Rape |
Robbery |
Aggravated Assault |
| 2001 |
364 | 1,770 | 6,860 | 11,945 |
| 2002 |
388 | 1,839 | 6,961 | 12,068 |
| 2003 |
413 | 1,773 | 6,672 | 11,517 |
| 2004 |
391 | 1,766 | 6,906 | 11,496 |
| 2005 |
461 | 1,721 | 7,507 | 11,711 |
| 2006 |
399 | 1,792 | 7,749 | 11,628 |
| 2007 |
406 | 1,745 | 7,651 | 10,996 |
| 2008 |
368 | 1,758 | 7,437 | 10,319 |
| 2009 |
347 | 1,511 | 6,257 | 9,764 |
| 2010 |
369 | 1,532 | 5,657 | 9,529 |
Property Crime Reports
| Rate Per 100K People |
|---|
| 2001 | 2,887 |
| 2002 | 2,849 |
| 2003 | 2,704 |
| 2004 | 2,677 |
| 2005 | 2,638 |
| 2006 | 2,478 |
| 2007 | 2,466 |
| 2008 | 2,518 |
| 2009 | 2,429 |
| 2010 | 2,327 |
| Vs. National Property Crime Rate |
|---|
| Year |
Burglary |
Larceny, Theft |
Motor Vehicle Theft |
| 2001 |
31,604 |
157,060 |
18,842 |
| 2002 |
31,757 |
157,548 |
18,478 |
| 2003 |
28,919 |
152,898 |
17,914 |
| 2004 |
28,793 |
153,464 |
17,411 |
| 2005 |
29,672 |
154,000 |
15,972 |
| 2006 |
31,913 |
142,679 |
14,814 |
| 2007 |
31,688 |
144,467 |
14,054 |
| 2008 |
31,993 |
150,382 |
13,259 |
| 2009 |
31,576 |
148,458 |
11,419 |
| 2010 |
30,629 |
145,019 |
10,548 |
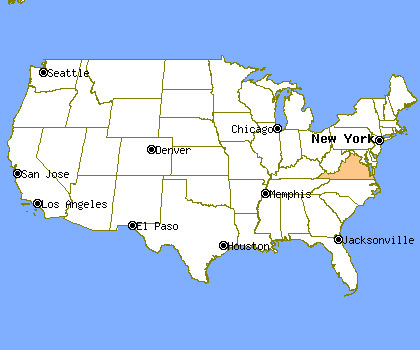
Location
Cities & Towns
A
B
C
D
E
F
G
H
I
J
K
L
M
N
O
P
Q
R
S
T
U
V
W
Y

