Mt. Pleasant, MI Profile
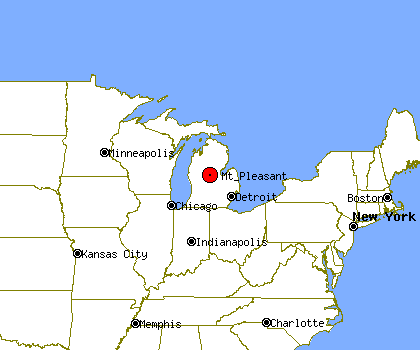
Mt. Pleasant, MI, population 26,733, is located
in Michigan's Isabella county,
about 60.8 miles from Lansing and 63.1 miles from Grand Rapids.
Through the 90's Mt. Pleasant's population has grown by about 11%.
It is estimated that in the first 5 years of the past decade the population of Mt. Pleasant has grown by about 1%. Since 2005 Mt. Pleasant's population has grown by about 2%.
Mt. Pleasant's property crime levels tend to be lower than
Michigan's average level.
The same data shows violent crime levels in Mt. Pleasant tend to be much lower than Michigan's average level.
Population Statistics
Gender
| Population by Gender |
|---|
| Males | 45% |
| Females | 55% |
Race
| Population by Race |
|---|
| White | 89% |
| African American | 4% |
| Native American | 2% |
| Asian | 3% |
| Hawaiian | 0% |
| Other/Mixed | 2% |
Age
| Median Age |
|---|
| Population | 9.99 |
| Males | 9.99 |
| Females | 9.99 |
| Males by Age | Females by Age |
|---|
| Under 20 | 9.99% | | Under 20: | 9.99% |
| 20 to 40 | 9.99% | | 20 to 40: | 9.99% |
| 40 to 60 | 6.00% | | 40 to 60: | 6.00% |
| Over 60 | 3.00% | | Over 60: | 6.00% |
Size
| Population by Year | Change Rate |
|---|
| 2000 | 25,947 | N/A |
| 2001 | 25,726 | -0.85% |
| 2002 | 25,716 | -0.04% |
| 2003 | 26,179 | 1.80% |
| 2004 | 26,640 | 1.76% |
| 2005 | 26,302 | -1.27% |
| 2006 | 26,255 | -0.18% |
| 2007 | 26,432 | 0.67% |
| 2008 | 26,436 | 0.02% |
| 2009 | 26,733 | 1.12% |
Economics
| Household Income |
|---|
| Median | $24,572 |
Law Enforcement Statistics
Violent Crime Reports
| Rate Per 100K People |
|---|
| 2001 | 138 |
| 2002 | N/A |
| 2003 | 203 |
| 2004 | 268 |
| 2005 | 245 |
| 2006 | 172 |
| 2007 | 217 |
| 2008 | 203 |
| 2009 | 176 |
| 2010 | 237 |
| Vs. State Violent Crime Rate |
|---|
| Year |
Murder, Man-Slaughter |
Forcible Rape |
Robbery |
Aggravated Assault |
| 2001 |
0 | 11 | 2 | 23 |
| 2002 |
- | - | - | - |
| 2003 |
0 | 9 | 4 | 40 |
| 2004 |
1 | 16 | 14 | 38 |
| 2005 |
1 | 12 | 7 | 43 |
| 2006 |
0 | 10 | 9 | 26 |
| 2007 |
1 | 15 | 4 | 37 |
| 2008 |
0 | 13 | 3 | 38 |
| 2009 |
0 | 4 | 2 | 41 |
| 2010 |
1 | 18 | 8 | 36 |
Property Crime Reports
| Rate Per 100K People |
|---|
| 2001 | 1,622 |
| 2002 | N/A |
| 2003 | 2,644 |
| 2004 | 2,495 |
| 2005 | 2,481 |
| 2006 | 2,486 |
| 2007 | 2,661 |
| 2008 | 2,108 |
| 2009 | 2,399 |
| 2010 | 1,953 |
| Vs. State Property Crime Rate |
|---|
| Year |
Burglary |
Larceny, Theft |
Motor Vehicle Theft |
| 2001 |
74 |
332 |
17 |
| 2002 |
- |
- |
- |
| 2003 |
101 |
555 |
34 |
| 2004 |
96 |
521 |
26 |
| 2005 |
92 |
528 |
17 |
| 2006 |
96 |
524 |
31 |
| 2007 |
138 |
534 |
27 |
| 2008 |
125 |
418 |
17 |
| 2009 |
106 |
513 |
23 |
| 2010 |
99 |
407 |
13 |
Location
| Land Area | 7.2 Square Miles |


