Flint, MI Profile
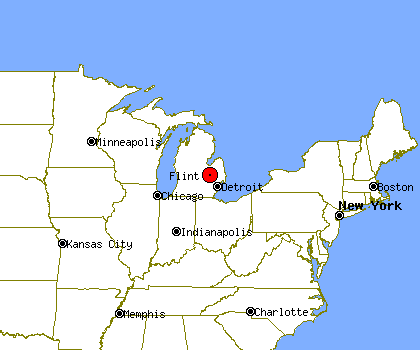
Flint, MI, population 111,475, is located
in Michigan's Genesee county,
about 44.8 miles from Sterling Heights and 47.7 miles from Livonia.
Through the 90's Flint's population has declined by about 11%.
It is estimated that in the first 5 years of the past decade the population of Flint has declined by about 5%. Since 2005 Flint's population has declined by about 5%.
Flint's property crime levels tend to be much higher than
Michigan's average level.
The same data shows violent crime levels in Flint tend to be much higher than Michigan's average level.
Population Statistics
Gender
| Population by Gender |
|---|
| Males | 47% |
| Females | 53% |
Race
| Population by Race |
|---|
| White | 41% |
| African American | 53% |
| Native American | 1% |
| Asian | 0% |
| Hawaiian | 0% |
| Other/Mixed | 5% |
Age
| Median Age |
|---|
| Population | 9.99 |
| Males | 9.99 |
| Females | 9.99 |
| Males by Age | Females by Age |
|---|
| Under 20 | 9.99% | | Under 20: | 9.99% |
| 20 to 40 | 9.99% | | 20 to 40: | 9.99% |
| 40 to 60 | 9.99% | | 40 to 60: | 9.99% |
| Over 60 | 6.00% | | Over 60: | 8.00% |
Size
| Population by Year | Change Rate |
|---|
| 2000 | 124,943 | N/A |
| 2001 | 123,349 | -1.28% |
| 2002 | 121,308 | -1.65% |
| 2003 | 119,949 | -1.12% |
| 2004 | 118,596 | -1.13% |
| 2005 | 117,271 | -1.12% |
| 2006 | 115,821 | -1.24% |
| 2007 | 114,449 | -1.18% |
| 2008 | 112,857 | -1.39% |
| 2009 | 111,475 | -1.22% |
Economics
| Household Income |
|---|
| Median | $28,015 |
Law Enforcement Statistics
Violent Crime Reports
| Rate Per 100K People |
|---|
| 2001 | 1,599 |
| 2002 | N/A |
| 2003 | 1,215 |
| 2004 | 1,926 |
| 2005 | 2,260 |
| 2006 | 2,596 |
| 2007 | 2,362 |
| 2008 | 2,024 |
| 2009 | 2,010 |
| 2010 | 2,208 |
| Vs. State Violent Crime Rate |
|---|
| Year |
Murder, Man-Slaughter |
Forcible Rape |
Robbery |
Aggravated Assault |
| 2001 |
41 | 95 | 508 | 1,364 |
| 2002 |
- | - | - | - |
| 2003 |
28 | 124 | 338 | 994 |
| 2004 |
39 | 140 | 473 | 1,672 |
| 2005 |
48 | 105 | 566 | 1,989 |
| 2006 |
54 | 143 | 627 | 2246 |
| 2007 |
30 | 109 | 665 | 1937 |
| 2008 |
32 | 103 | 686 | 1476 |
| 2009 |
36 | 91 | 590 | 1527 |
| 2010 |
53 | 92 | 670 | 1597 |
Property Crime Reports
| Rate Per 100K People |
|---|
| 2001 | 7,129 |
| 2002 | N/A |
| 2003 | 5,498 |
| 2004 | 6,011 |
| 2005 | 6,434 |
| 2006 | 6,864 |
| 2007 | 6,245 |
| 2008 | 6,072 |
| 2009 | 5,729 |
| 2010 | 5,709 |
| Vs. State Property Crime Rate |
|---|
| Year |
Burglary |
Larceny, Theft |
Motor Vehicle Theft |
| 2001 |
2,695 |
4,291 |
1,968 |
| 2002 |
- |
- |
- |
| 2003 |
2,063 |
3,353 |
1,298 |
| 2004 |
2,477 |
3,214 |
1,563 |
| 2005 |
2,634 |
3,492 |
1,583 |
| 2006 |
3058 |
3538 |
1521 |
| 2007 |
3241 |
2965 |
1040 |
| 2008 |
3273 |
2707 |
909 |
| 2009 |
3057 |
2664 |
676 |
| 2010 |
3648 |
1936 |
653 |
Location
| Land Area | 33.8 Square Miles |
| Water Area | 0.4 Square Miles |


