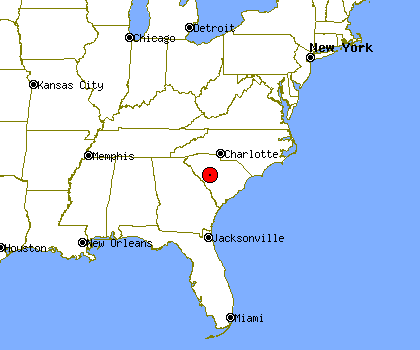
Batesburg-Leesville, SC Profile
Batesburg-Leesville, SC, population 5,653, is located
in South Carolina's Lexington county,
about 29.5 miles from Columbia and 39.5 miles from Augusta.
It is estimated that in the first 5 years of the past decade the population of Batesburg-Leesville has grown by about 1%. Since 2005 Batesburg-Leesville's population has grown by about 3%.
Batesburg-Leesville's property crime levels tend to be about the same as
South Carolina's average level.
The same data shows violent crime levels in Batesburg-Leesville tend to be about the same as South Carolina's average level.
Population Statistics
Gender
| Population by Gender |
|---|
| Males | 45% |
| Females | 55% |
Race
| Population by Race |
|---|
| White | 53% |
| African American | 46% |
| Native American | 0% |
| Asian | 0% |
| Hawaiian | 0% |
| Other/Mixed | 1% |
Age
| Median Age |
|---|
| Population | 9.99 |
| Males | 9.99 |
| Females | 9.99 |
| Males by Age | Females by Age |
|---|
| Under 20 | 9.99% | | Under 20: | 9.99% |
| 20 to 40 | 9.99% | | 20 to 40: | 9.99% |
| 40 to 60 | 9.99% | | 40 to 60: | 9.99% |
| Over 60 | 8.00% | | Over 60: | 9.99% |
Size
| Population by Year | Change Rate |
|---|
| 2000 | 5,538 | N/A |
| 2001 | 5,518 | -0.36% |
| 2002 | 5,487 | -0.56% |
| 2003 | 5,500 | 0.24% |
| 2004 | 5,491 | -0.16% |
| 2005 | 5,510 | 0.35% |
| 2006 | 5,559 | 0.89% |
| 2007 | 5,546 | -0.23% |
| 2008 | 5,593 | 0.85% |
| 2009 | 5,653 | 1.07% |
Economics
| Household Income |
|---|
| Median | $32,865 |
Law Enforcement Statistics
Violent Crime Reports
| Rate Per 100K People |
|---|
| 2001 | 1,110 |
| 2002 | 1,328 |
| 2003 | 825 |
| 2004 | 571 |
| 2005 | 534 |
| 2006 | 495 |
| 2007 | 1,192 |
| 2008 | 848 |
| 2009 | 555 |
| 2010 | 705 |
| Vs. State Violent Crime Rate |
|---|
| Year |
Murder, Man-Slaughter |
Forcible Rape |
Robbery |
Aggravated Assault |
| 2001 |
0 | 2 | 11 | 49 |
| 2002 |
1 | 2 | 8 | 64 |
| 2003 |
0 | 3 | 7 | 36 |
| 2004 |
2 | 2 | 6 | 22 |
| 2005 |
0 | 5 | 4 | 21 |
| 2006 |
0 | 1 | 1 | 26 |
| 2007 |
0 | 3 | 3 | 61 |
| 2008 |
0 | 3 | 9 | 35 |
| 2009 |
1 | 1 | 2 | 27 |
| 2010 |
0 | 3 | 5 | 32 |
Property Crime Reports
| Rate Per 100K People |
|---|
| 2001 | 4,958 |
| 2002 | 5,028 |
| 2003 | 5,400 |
| 2004 | 4,693 |
| 2005 | 4,625 |
| 2006 | 4,292 |
| 2007 | 5,747 |
| 2008 | 5,410 |
| 2009 | 5,086 |
| 2010 | 4,603 |
| Vs. State Property Crime Rate |
|---|
| Year |
Burglary |
Larceny, Theft |
Motor Vehicle Theft |
| 2001 |
52 |
207 |
18 |
| 2002 |
51 |
219 |
14 |
| 2003 |
66 |
212 |
23 |
| 2004 |
60 |
188 |
15 |
| 2005 |
62 |
188 |
10 |
| 2006 |
64 |
163 |
16 |
| 2007 |
55 |
239 |
29 |
| 2008 |
67 |
210 |
23 |
| 2009 |
73 |
189 |
22 |
| 2010 |
69 |
183 |
9 |
Location


