Winston-Salem, NC Profile
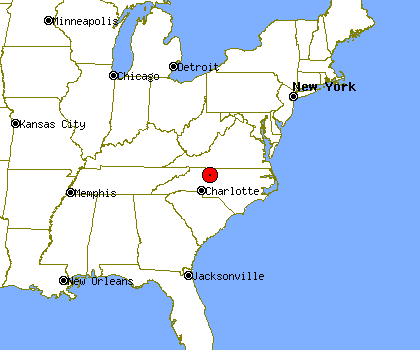
Winston-Salem, NC, population 229,828, is located
in North Carolina's Forsyth county,
about 25.3 miles from Greensboro and 69.1 miles from Charlotte.
Through the 90's Winston-Salem's population has grown by about 29%.
It is estimated that in the first 5 years of the past decade the population of Winston-Salem has grown by about 4%. Since 2005 Winston-Salem's population has grown by about 6%.
Winston-Salem's property crime levels tend to be much higher than
North Carolina's average level.
The same data shows violent crime levels in Winston-Salem tend to be much higher than North Carolina's average level.
Population Statistics
Gender
| Population by Gender |
|---|
| Males | 47% |
| Females | 53% |
Race
| Population by Race |
|---|
| White | 56% |
| African American | 37% |
| Native American | 0% |
| Asian | 1% |
| Hawaiian | 0% |
| Other/Mixed | 6% |
Age
| Median Age |
|---|
| Population | 9.99 |
| Males | 9.99 |
| Females | 9.99 |
| Males by Age | Females by Age |
|---|
| Under 20 | 9.99% | | Under 20: | 9.99% |
| 20 to 40 | 9.99% | | 20 to 40: | 9.99% |
| 40 to 60 | 9.99% | | 40 to 60: | 9.99% |
| Over 60 | 7.00% | | Over 60: | 9.99% |
Size
| Population by Year | Change Rate |
|---|
| 2000 | 201,450 | N/A |
| 2001 | 205,210 | 1.87% |
| 2002 | 207,556 | 1.14% |
| 2003 | 210,731 | 1.53% |
| 2004 | 213,463 | 1.30% |
| 2005 | 216,961 | 1.64% |
| 2006 | 220,126 | 1.46% |
| 2007 | 223,532 | 1.55% |
| 2008 | 227,834 | 1.92% |
| 2009 | 229,828 | 0.88% |
Economics
| Household Income |
|---|
| Median | $37,006 |
Law Enforcement Statistics
Violent Crime Reports
| Rate Per 100K People |
|---|
| 2001 | 935 |
| 2002 | 841 |
| 2003 | 827 |
| 2004 | 782 |
| 2005 | 842 |
| 2006 | 837 |
| 2007 | N/A |
| 2008 | 918 |
| 2009 | 753 |
| 2010 | 651 |
| Vs. State Violent Crime Rate |
|---|
| Year |
Murder, Man-Slaughter |
Forcible Rape |
Robbery |
Aggravated Assault |
| 2001 |
15 | 120 | 701 | 930 |
| 2002 |
15 | 116 | 549 | 934 |
| 2003 |
11 | 118 | 547 | 903 |
| 2004 |
21 | 96 | 537 | 858 |
| 2005 |
16 | 118 | 608 | 897 |
| 2006 |
20 | 126 | 669 | 839 |
| 2007 |
- | - | - | - |
| 2008 |
19 | 104 | 723 | 1233 |
| 2009 |
15 | 110 | 575 | 1039 |
| 2010 |
11 | 96 | 449 | 961 |
Property Crime Reports
| Rate Per 100K People |
|---|
| 2001 | 7,553 |
| 2002 | 6,799 |
| 2003 | 7,301 |
| 2004 | 6,392 |
| 2005 | 6,224 |
| 2006 | 6,805 |
| 2007 | N/A |
| 2008 | 6,621 |
| 2009 | 5,969 |
| 2010 | 5,731 |
| Vs. State Property Crime Rate |
|---|
| Year |
Burglary |
Larceny, Theft |
Motor Vehicle Theft |
| 2001 |
3,444 |
9,798 |
1,029 |
| 2002 |
3,311 |
8,757 |
987 |
| 2003 |
3,957 |
8,810 |
1,171 |
| 2004 |
3,546 |
7,728 |
1,083 |
| 2005 |
4,016 |
7,146 |
956 |
| 2006 |
4289 |
8126 |
1034 |
| 2007 |
- |
- |
- |
| 2008 |
4670 |
9234 |
1091 |
| 2009 |
4532 |
8429 |
827 |
| 2010 |
4482 |
8225 |
642 |
Location
| Elevation | 912 feet above sea level |
| Land Area | 71.1 Square Miles |
| Water Area | 0.6 Square Miles |


