St. Matthews, KY Profile
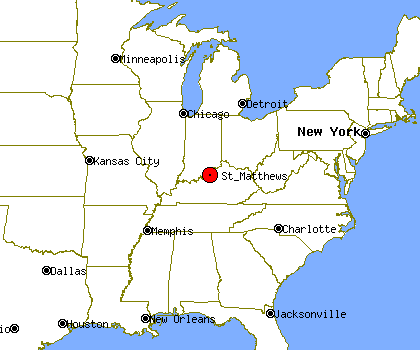
St. Matthews, KY, population 18,750, is located
in Kentucky's Jefferson county,
about 5.6 miles from Louisville and 66.6 miles from Lexington.
It is estimated that in the first 5 years of the past decade the population of St. Matthews has grown by about 9%. Since 2005 St. Matthews's population has grown by about 8%.
St. Matthews's property crime levels tend to be
Kentucky's average level.
Population Statistics
Gender
| Population by Gender |
|---|
| Males | 46% |
| Females | 54% |
Race
| Population by Race |
|---|
| White | 90% |
| African American | 5% |
| Native American | 0% |
| Asian | 3% |
| Hawaiian | 0% |
| Other/Mixed | 2% |
Age
| Median Age |
|---|
| Population | 9.99 |
| Males | 9.99 |
| Females | 9.99 |
| Males by Age | Females by Age |
|---|
| Under 20 | 9.99% | | Under 20: | 9.00% |
| 20 to 40 | 9.99% | | 20 to 40: | 9.99% |
| 40 to 60 | 9.99% | | 40 to 60: | 9.99% |
| Over 60 | 7.00% | | Over 60: | 9.99% |
Size
| Population by Year | Change Rate |
|---|
| 2000 | 17,304 | N/A |
| 2001 | 17,317 | 0.08% |
| 2002 | 17,328 | 0.06% |
| 2003 | 17,371 | 0.25% |
| 2004 | 17,332 | -0.22% |
| 2005 | 17,303 | -0.17% |
| 2006 | 17,703 | 2.31% |
| 2007 | 18,135 | 2.44% |
| 2008 | 18,673 | 2.97% |
| 2009 | 18,750 | 0.41% |
Economics
| Household Income |
|---|
| Median | $42,219 |
Law Enforcement Statistics
Violent Crime Reports
| Rate Per 100K People |
|---|
| 2001 | N/A |
| 2002 | N/A |
| 2003 | N/A |
| 2004 | 461 |
| 2005 | N/A |
| 2006 | 189 |
| 2007 | 255 |
| 2008 | 279 |
| 2009 | 143 |
| 2010 | 143 |
| Vs. State Violent Crime Rate |
|---|
| Year |
Murder, Man-Slaughter |
Forcible Rape |
Robbery |
Aggravated Assault |
| 2001 |
- | - | - | - |
| 2002 |
- | - | - | - |
| 2003 |
- | - | - | - |
| 2004 |
0 | 2 | 20 | 59 |
| 2005 |
- | - | - | - |
| 2006 |
0 | 1 | 20 | 12 |
| 2007 |
0 | 2 | 28 | 15 |
| 2008 |
0 | 2 | 35 | 14 |
| 2009 |
0 | 4 | 20 | 3 |
| 2010 |
0 | 1 | 15 | 11 |
Property Crime Reports
| Rate Per 100K People |
|---|
| 2001 | N/A |
| 2002 | N/A |
| 2003 | N/A |
| 2004 | 4,220 |
| 2005 | N/A |
| 2006 | 4,701 |
| 2007 | 4,119 |
| 2008 | 4,229 |
| 2009 | 4,112 |
| 2010 | 3,940 |
| Vs. State Property Crime Rate |
|---|
| Year |
Burglary |
Larceny, Theft |
Motor Vehicle Theft |
| 2001 |
- |
- |
- |
| 2002 |
- |
- |
- |
| 2003 |
- |
- |
- |
| 2004 |
114 |
597 |
30 |
| 2005 |
- |
- |
- |
| 2006 |
112 |
664 |
44 |
| 2007 |
128 |
562 |
38 |
| 2008 |
88 |
652 |
33 |
| 2009 |
114 |
638 |
24 |
| 2010 |
124 |
595 |
25 |
Location