Radcliff, KY Profile
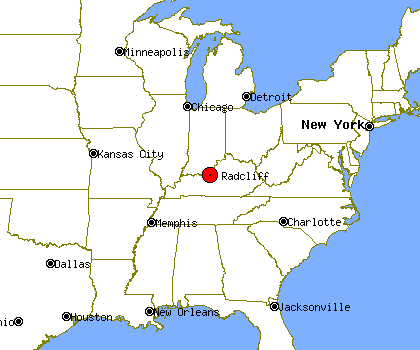
Radcliff, KY, population 22,253, is located
in Kentucky's Hardin county,
about 30.4 miles from Louisville and 82.6 miles from Lexington.
Through the 90's Radcliff's population has grown by about 11%.
It is estimated that in the first 5 years of the past decade the population of Radcliff has declined by about 2%. Since 2005 Radcliff's population has grown by about 3%.
Radcliff's property crime levels tend to be about the same as
Kentucky's average level.
The same data shows violent crime levels in Radcliff tend to be higher than Kentucky's average level.
Population Statistics
Gender
| Population by Gender |
|---|
| Males | 49% |
| Females | 51% |
Race
| Population by Race |
|---|
| White | 63% |
| African American | 26% |
| Native American | 1% |
| Asian | 4% |
| Hawaiian | 0% |
| Other/Mixed | 6% |
Age
| Median Age |
|---|
| Population | 9.99 |
| Males | 9.99 |
| Females | 9.99 |
| Males by Age | Females by Age |
|---|
| Under 20 | 9.99% | | Under 20: | 9.99% |
| 20 to 40 | 9.99% | | 20 to 40: | 9.99% |
| 40 to 60 | 9.99% | | 40 to 60: | 9.99% |
| Over 60 | 5.00% | | Over 60: | 7.00% |
Size
| Population by Year | Change Rate |
|---|
| 2000 | 22,083 | N/A |
| 2001 | 22,074 | -0.04% |
| 2002 | 21,908 | -0.75% |
| 2003 | 21,785 | -0.56% |
| 2004 | 21,603 | -0.84% |
| 2005 | 21,549 | -0.25% |
| 2006 | 21,751 | 0.94% |
| 2007 | 21,998 | 1.14% |
| 2008 | 22,107 | 0.50% |
| 2009 | 22,253 | 0.66% |
Economics
| Household Income |
|---|
| Median | $35,763 |
Law Enforcement Statistics
Violent Crime Reports
| Rate Per 100K People |
|---|
| 2001 | 317 |
| 2002 | 351 |
| 2003 | 416 |
| 2004 | 390 |
| 2005 | 391 |
| 2006 | N/A |
| 2007 | N/A |
| 2008 | N/A |
| 2009 | 1,277 |
| 2010 | 769 |
| Vs. State Violent Crime Rate |
|---|
| Year |
Murder, Man-Slaughter |
Forcible Rape |
Robbery |
Aggravated Assault |
| 2001 |
0 | 16 | 23 | 31 |
| 2002 |
0 | 15 | 13 | 50 |
| 2003 |
0 | 19 | 23 | 50 |
| 2004 |
0 | 19 | 24 | 43 |
| 2005 |
0 | 14 | 23 | 48 |
| 2006 |
0 | 15 | 16 | - |
| 2007 |
1 | 18 | 21 | - |
| 2008 |
0 | 24 | 22 | - |
| 2009 |
1 | 19 | 12 | 249 |
| 2010 |
0 | 10 | 13 | 148 |
Property Crime Reports
| Rate Per 100K People |
|---|
| 2001 | 3,418 |
| 2002 | 2,815 |
| 2003 | 3,387 |
| 2004 | 3,030 |
| 2005 | 3,392 |
| 2006 | 2,810 |
| 2007 | 2,704 |
| 2008 | 2,943 |
| 2009 | 3,312 |
| 2010 | 3,191 |
| Vs. State Property Crime Rate |
|---|
| Year |
Burglary |
Larceny, Theft |
Motor Vehicle Theft |
| 2001 |
168 |
560 |
27 |
| 2002 |
140 |
473 |
13 |
| 2003 |
179 |
550 |
20 |
| 2004 |
173 |
472 |
23 |
| 2005 |
137 |
572 |
29 |
| 2006 |
149 |
430 |
29 |
| 2007 |
155 |
395 |
33 |
| 2008 |
141 |
480 |
24 |
| 2009 |
165 |
546 |
18 |
| 2010 |
164 |
521 |
25 |
Location
| Land Area | 10.3 Square Miles |


