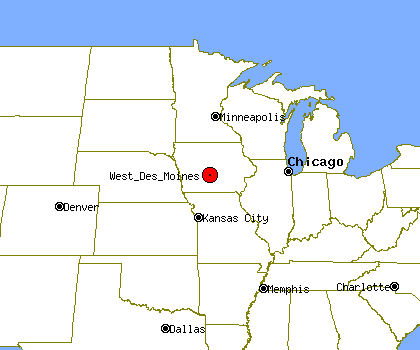
West Des Moines, IA Profile
West Des Moines, IA, population 56,954, is located
in Iowa's Polk county,
about 5.5 miles from Des Moines and 110.7 miles from Cedar Rapids.
Through the 90's West Des Moines's population has grown by about 46%.
It is estimated that in the first 5 years of the past decade the population of West Des Moines has grown by about 14%. Since 2005 West Des Moines's population has grown by about 8%.
West Des Moines's property crime levels tend to be about the same as
Iowa's average level.
The same data shows violent crime levels in West Des Moines tend to be lower than Iowa's average level.
Population Statistics
Gender
| Population by Gender |
|---|
| Males | 48% |
| Females | 52% |
Race
| Population by Race |
|---|
| White | 93% |
| African American | 2% |
| Native American | 0% |
| Asian | 3% |
| Hawaiian | 0% |
| Other/Mixed | 2% |
Age
| Median Age |
|---|
| Population | 9.99 |
| Males | 9.99 |
| Females | 9.99 |
| Males by Age | Females by Age |
|---|
| Under 20 | 9.99% | | Under 20: | 9.99% |
| 20 to 40 | 9.99% | | 20 to 40: | 9.99% |
| 40 to 60 | 9.99% | | 40 to 60: | 9.99% |
| Over 60 | 5.00% | | Over 60: | 8.00% |
Size
| Population by Year | Change Rate |
|---|
| 2000 | 47,189 | N/A |
| 2001 | 47,886 | 1.48% |
| 2002 | 50,295 | 5.03% |
| 2003 | 52,125 | 3.64% |
| 2004 | 51,942 | -0.35% |
| 2005 | 52,792 | 1.64% |
| 2006 | 53,947 | 2.19% |
| 2007 | 54,811 | 1.60% |
| 2008 | 55,503 | 1.26% |
| 2009 | 56,954 | 2.61% |
Economics
| Household Income |
|---|
| Median | $54,139 |
Law Enforcement Statistics
Violent Crime Reports
| Rate Per 100K People |
|---|
| 2001 | 166 |
| 2002 | 103 |
| 2003 | 140 |
| 2004 | 172 |
| 2005 | 171 |
| 2006 | 185 |
| 2007 | 160 |
| 2008 | 235 |
| 2009 | 129 |
| 2010 | 186 |
| Vs. State Violent Crime Rate |
|---|
| Year |
Murder, Man-Slaughter |
Forcible Rape |
Robbery |
Aggravated Assault |
| 2001 |
0 | 6 | 23 | 48 |
| 2002 |
1 | 4 | 15 | 28 |
| 2003 |
1 | 9 | 10 | 50 |
| 2004 |
0 | 18 | 8 | 63 |
| 2005 |
0 | 14 | 11 | 63 |
| 2006 |
0 | 20 | 9 | 69 |
| 2007 |
0 | 15 | 15 | 58 |
| 2008 |
1 | 18 | 28 | 84 |
| 2009 |
0 | 18 | 6 | 49 |
| 2010 |
0 | 22 | 11 | 76 |
Property Crime Reports
| Rate Per 100K People |
|---|
| 2001 | 3,749 |
| 2002 | 3,784 |
| 2003 | 3,578 |
| 2004 | 3,124 |
| 2005 | 3,504 |
| 2006 | 3,482 |
| 2007 | 2,884 |
| 2008 | 3,131 |
| 2009 | 3,142 |
| 2010 | 2,962 |
| Vs. State Property Crime Rate |
|---|
| Year |
Burglary |
Larceny, Theft |
Motor Vehicle Theft |
| 2001 |
189 |
1,458 |
91 |
| 2002 |
217 |
1,469 |
76 |
| 2003 |
310 |
1,409 |
73 |
| 2004 |
270 |
1,287 |
64 |
| 2005 |
279 |
1,459 |
69 |
| 2006 |
241 |
1538 |
68 |
| 2007 |
226 |
1315 |
45 |
| 2008 |
217 |
1482 |
47 |
| 2009 |
196 |
1536 |
40 |
| 2010 |
173 |
1516 |
47 |
Location
| Elevation | 820 feet above sea level |
| Land Area | 17.9 Square Miles |
| Water Area | 0.7 Square Miles |


