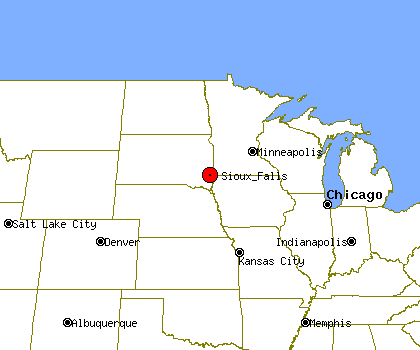
Sioux Falls, SD Profile
Sioux Falls, SD, population 158,008, is located
in South Dakota's Minnehaha county,
about 163.2 miles from Omaha and 190.2 miles from Lincoln.
Through the 90's Sioux Falls's population has grown by about 23%.
It is estimated that in the first 5 years of the past decade the population of Sioux Falls has grown by about 13%. Since 2005 Sioux Falls's population has grown by about 9%.
Sioux Falls's property crime levels tend to be higher than South Dakota's average level.
The same data shows violent crime levels in Sioux Falls tend to be much higher than South Dakota's average level.
Population Statistics
Gender
| Population by Gender |
|---|
| Males | 49% |
| Females | 51% |
Race
| Population by Race |
|---|
| White | 92% |
| African American | 2% |
| Native American | 2% |
| Asian | 1% |
| Hawaiian | 0% |
| Other/Mixed | 3% |
Age
| Median Age |
|---|
| Population | 9.99 |
| Males | 9.99 |
| Females | 9.99 |
| Males by Age | Females by Age |
|---|
| Under 20 | 9.99% | | Under 20: | 9.99% |
| 20 to 40 | 9.99% | | 20 to 40: | 9.99% |
| 40 to 60 | 9.99% | | 40 to 60: | 9.99% |
| Over 60 | 6.00% | | Over 60: | 8.00% |
Size
| Population by Year | Change Rate |
|---|
| 2000 | 124,819 | N/A |
| 2001 | 129,980 | 4.13% |
| 2002 | 133,281 | 2.54% |
| 2003 | 137,575 | 3.22% |
| 2004 | 141,488 | 2.84% |
| 2005 | 145,095 | 2.55% |
| 2006 | 148,244 | 2.17% |
| 2007 | 151,761 | 2.37% |
| 2008 | 155,084 | 2.19% |
| 2009 | 158,008 | 1.89% |
Economics
| Household Income |
|---|
| Median | $41,221 |
Law Enforcement Statistics
Violent Crime Reports
| Rate Per 100K People |
|---|
| 2001 | 261 |
| 2002 | 317 |
| 2003 | 299 |
| 2004 | 309 |
| 2005 | 344 |
| 2006 | 303 |
| 2007 | 263 |
| 2008 | 337 |
| 2009 | 286 |
| 2010 | 300 |
| Vs. State Violent Crime Rate |
|---|
| Year |
Murder, Man-Slaughter |
Forcible Rape |
Robbery |
Aggravated Assault |
| 2001 |
2 | 76 | 38 | 208 |
| 2002 |
1 | 115 | 52 | 228 |
| 2003 |
3 | 104 | 40 | 245 |
| 2004 |
3 | 108 | 43 | 263 |
| 2005 |
4 | 145 | 71 | 253 |
| 2006 |
7 | 115 | 34 | 270 |
| 2007 |
2 | 95 | 44 | 240 |
| 2008 |
5 | 130 | 46 | 341 |
| 2009 |
1 | 133 | 47 | 273 |
| 2010 |
3 | 96 | 55 | 328 |
Property Crime Reports
| Rate Per 100K People |
|---|
| 2001 | 3,063 |
| 2002 | 3,034 |
| 2003 | 3,070 |
| 2004 | 3,242 |
| 2005 | 3,099 |
| 2006 | 2,558 |
| 2007 | 2,607 |
| 2008 | 2,538 |
| 2009 | 2,905 |
| 2010 | 3,021 |
| Vs. State Property Crime Rate |
|---|
| Year |
Burglary |
Larceny, Theft |
Motor Vehicle Theft |
| 2001 |
681 |
2,943 |
182 |
| 2002 |
652 |
2,946 |
195 |
| 2003 |
770 |
2,997 |
256 |
| 2004 |
916 |
3,176 |
284 |
| 2005 |
682 |
3,253 |
329 |
| 2006 |
768 |
2616 |
212 |
| 2007 |
631 |
2881 |
268 |
| 2008 |
659 |
3030 |
248 |
| 2009 |
748 |
3584 |
277 |
| 2010 |
989 |
3637 |
228 |
Location
| Elevation | 1,442 feet above sea level |
| Land Area | 45.1 Square Miles |


