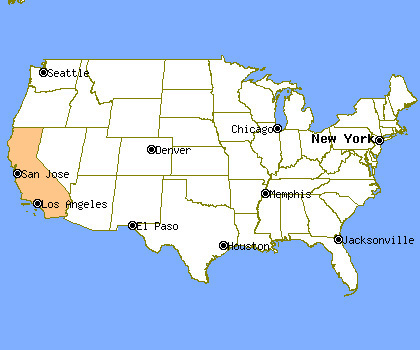
California Profile
Total Population: 36,961,664
Capital: Sacramento
Symbols
| State Flag |
|---|
 |
| State Seal |
|---|
 |
Population Statistics
Gender
| Population by Gender |
|---|
| Males | 50% |
| Females | 50% |
Race
| Population by Race |
|---|
| White | 60% |
| African American | 7% |
| Native American | 1% |
| Asian | 11% |
| Hawaiian | 0% |
| Other/Mixed | 21% |
Age
| Median Age |
|---|
| Population | 33.3 |
| Males | 32.2 |
| Females | 34.4 |
| Males by Age | Females by Age |
|---|
| Under 20 | 16% | | Under 20: | 15% |
| 20 to 40 | 16% | | 20 to 40: | 14% |
| 40 to 60 | 12% | | 40 to 60: | 13% |
| Over 60 | 6% | | Over 60: | 8% |
Size
| Population by Year | Annual Change |
|---|
| 2000 | 33,871,648 | N/A |
| 2001 | 34,485,623 | 1.81% |
| 2002 | 34,876,194 | 1.13% |
| 2003 | 35,251,107 | 1.07% |
| 2004 | 35,558,419 | 0.87% |
| 2005 | 35,795,255 | 0.67% |
| 2006 | 35,979,208 | 0.51% |
| 2007 | 36,226,122 | 0.69% |
| 2008 | 36,580,371 | 0.98% |
| 2009 | 36,961,664 | 1.04% |
Law Enforcement Statistics
Violent Crime Reports
| Rate Per 100K People |
|---|
| 2001 | 617 |
| 2002 | 593 |
| 2003 | 579 |
| 2004 | 552 |
| 2005 | 526 |
| 2006 | 532 |
| 2007 | 523 |
| 2008 | 504 |
| 2009 | 472 |
| 2010 | 441 |
| Vs. National Violent Crime Rate |
|---|
| Year |
Murder, Man-Slaughter |
Forcible Rape |
Robbery |
Aggravated Assault |
| 2001 |
2,206 | 9,961 | 64,545 | 136,143 |
| 2002 |
2,395 | 10,198 | 64,968 | 130,827 |
| 2003 |
2,407 | 9,994 | 63,770 | 129,380 |
| 2004 |
2,392 | 9,615 | 61,768 | 124,295 |
| 2005 |
2,503 | 9,392 | 63,622 | 114,661 |
| 2006 |
2,485 | 9,212 | 70,968 | 111,455 |
| 2007 |
2,260 | 9,013 | 70,542 | 109,210 |
| 2008 |
2,142 | 8,903 | 69,385 | 104,743 |
| 2009 |
1,972 | 8,713 | 64,093 | 99,681 |
| 2010 |
1,809 | 8,331 | 58,116 | 95,877 |
Property Crime Reports
| Rate Per 100K People |
|---|
| 2001 | 3,286 |
| 2002 | 3,350 |
| 2003 | 3,424 |
| 2004 | 3,419 |
| 2005 | 3,323 |
| 2006 | 3,171 |
| 2007 | 3,033 |
| 2008 | 2,940 |
| 2009 | 2,732 |
| 2010 | 2,636 |
| Vs. National Property Crime Rate |
|---|
| Year |
Burglary |
Larceny, Theft |
Motor Vehicle Theft |
| 2001 |
232,000 |
697,669 |
204,033 |
| 2002 |
238,428 |
715,692 |
222,364 |
| 2003 |
242,274 |
731,486 |
241,326 |
| 2004 |
245,903 |
728,687 |
252,604 |
| 2005 |
250,521 |
692,467 |
257,543 |
| 2006 |
246,464 |
666,860 |
242,693 |
| 2007 |
237,025 |
652,243 |
219,392 |
| 2008 |
237,835 |
650,385 |
192,527 |
| 2009 |
230,137 |
615,456 |
164,021 |
| 2010 |
228,857 |
600,558 |
152,524 |
Location

Cities & Towns
A
B
C
D
E
F
G
H
I
J
K
L
M
N
O
P
Q
R
S
T
U
V
W
Y


