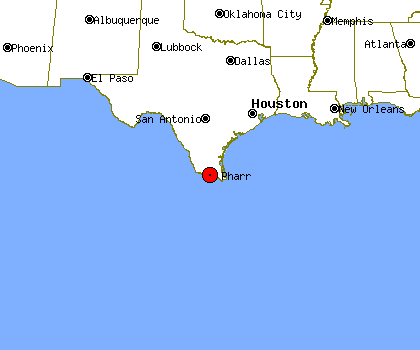
Pharr, TX Profile
Pharr, TX, population 66,231, is located
in Texas's Hidalgo county,
about 2.9 miles from McAllen and 47.2 miles from Brownsville.
Through the 90's Pharr's population has grown by about 42%.
It is estimated that in the first 5 years of the past decade the population of Pharr has grown by about 26%. Since 2005 Pharr's population has grown by about 14%.
Pharr's property crime levels tend to be about the same as
Texas's average level.
The same data shows violent crime levels in Pharr tend to be about the same as Texas's average level.
Population Statistics
Gender
| Population by Gender |
|---|
| Males | 48% |
| Females | 52% |
Race
| Population by Race |
|---|
| White | 79% |
| African American | 0% |
| Native American | 1% |
| Asian | 0% |
| Hawaiian | 0% |
| Other/Mixed | 20% |
Age
| Median Age |
|---|
| Population | 9.99 |
| Males | 9.99 |
| Females | 9.99 |
| Males by Age | Females by Age |
|---|
| Under 20 | 9.99% | | Under 20: | 9.99% |
| 20 to 40 | 9.99% | | 20 to 40: | 9.99% |
| 40 to 60 | 8.00% | | 40 to 60: | 9.99% |
| Over 60 | 7.00% | | Over 60: | 8.00% |
Size
| Population by Year | Change Rate |
|---|
| 2000 | 46,977 | N/A |
| 2001 | 48,985 | 4.27% |
| 2002 | 50,888 | 3.88% |
| 2003 | 53,900 | 5.92% |
| 2004 | 55,847 | 3.61% |
| 2005 | 57,926 | 3.72% |
| 2006 | 59,918 | 3.44% |
| 2007 | 62,926 | 5.02% |
| 2008 | 64,815 | 3.00% |
| 2009 | 66,231 | 2.18% |
Economics
| Household Income |
|---|
| Median | $24,333 |
Law Enforcement Statistics
Violent Crime Reports
| Rate Per 100K People |
|---|
| 2001 | 511 |
| 2002 | 624 |
| 2003 | 638 |
| 2004 | 446 |
| 2005 | 343 |
| 2006 | 313 |
| 2007 | 391 |
| 2008 | 393 |
| 2009 | 447 |
| 2010 | 368 |
| Vs. State Violent Crime Rate |
|---|
| Year |
Murder, Man-Slaughter |
Forcible Rape |
Robbery |
Aggravated Assault |
| 2001 |
3 | 16 | 43 | 182 |
| 2002 |
7 | 22 | 81 | 194 |
| 2003 |
5 | 10 | 76 | 241 |
| 2004 |
4 | 18 | 58 | 167 |
| 2005 |
4 | 17 | 52 | 125 |
| 2006 |
4 | 26 | 62 | 98 |
| 2007 |
7 | 23 | 64 | 155 |
| 2008 |
3 | 20 | 80 | 157 |
| 2009 |
2 | 23 | 84 | 193 |
| 2010 |
6 | 13 | 55 | 177 |
Property Crime Reports
| Rate Per 100K People |
|---|
| 2001 | 5,480 |
| 2002 | 5,708 |
| 2003 | 5,920 |
| 2004 | 5,091 |
| 2005 | 5,040 |
| 2006 | 5,505 |
| 2007 | 5,805 |
| 2008 | 5,646 |
| 2009 | 5,853 |
| 2010 | 5,408 |
| Vs. State Property Crime Rate |
|---|
| Year |
Burglary |
Larceny, Theft |
Motor Vehicle Theft |
| 2001 |
532 |
1,998 |
85 |
| 2002 |
524 |
2,178 |
80 |
| 2003 |
664 |
2,329 |
90 |
| 2004 |
584 |
2,148 |
87 |
| 2005 |
573 |
2,183 |
156 |
| 2006 |
597 |
2525 |
217 |
| 2007 |
792 |
2586 |
318 |
| 2008 |
868 |
2503 |
360 |
| 2009 |
842 |
2773 |
343 |
| 2010 |
698 |
2697 |
297 |
Location
| Elevation | 115 feet above sea level |
| Land Area | 15.8 Square Miles |


