Flower Mound, TX Profile
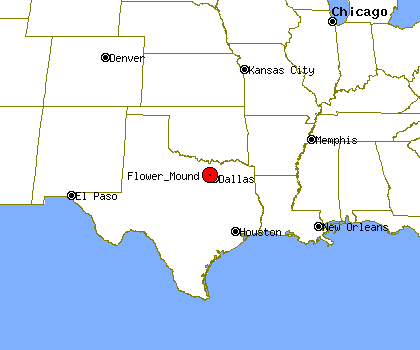
Flower Mound, TX, population 70,202, is located
in Texas's Denton county,
about 12.7 miles from Carrollton and 16.3 miles from Irving.
Through the 90's Flower Mound's population has grown by about 227%.
It is estimated that in the first 5 years of the past decade the population of Flower Mound has grown by about 25%. Since 2005 Flower Mound's population has grown by about 10%.
Flower Mound's property crime levels tend to be much lower than
Texas's average level.
The same data shows violent crime levels in Flower Mound tend to be much lower than Texas's average level.
Population Statistics
Gender
| Population by Gender |
|---|
| Males | 50% |
| Females | 50% |
Race
| Population by Race |
|---|
| White | 90% |
| African American | 3% |
| Native American | 0% |
| Asian | 3% |
| Hawaiian | 0% |
| Other/Mixed | 4% |
Age
| Median Age |
|---|
| Population | 9.99 |
| Males | 9.99 |
| Females | 9.99 |
| Males by Age | Females by Age |
|---|
| Under 20 | 9.99% | | Under 20: | 9.99% |
| 20 to 40 | 9.99% | | 20 to 40: | 9.99% |
| 40 to 60 | 9.99% | | 40 to 60: | 9.99% |
| Over 60 | 2.00% | | Over 60: | 2.00% |
Size
| Population by Year | Change Rate |
|---|
| 2000 | 50,804 | N/A |
| 2001 | 55,900 | 9.99% |
| 2002 | 58,863 | 5.30% |
| 2003 | 60,858 | 3.39% |
| 2004 | 62,496 | 2.69% |
| 2005 | 63,927 | 2.29% |
| 2006 | 66,468 | 3.97% |
| 2007 | 68,449 | 2.98% |
| 2008 | 69,388 | 1.37% |
| 2009 | 70,202 | 1.17% |
Economics
| Household Income |
|---|
| Median | $95,416 |
Law Enforcement Statistics
Violent Crime Reports
| Rate Per 100K People |
|---|
| 2001 | 64 |
| 2002 | 94 |
| 2003 | 77 |
| 2004 | 75 |
| 2005 | 49 |
| 2006 | 58 |
| 2007 | 70 |
| 2008 | 76 |
| 2009 | 66 |
| 2010 | 60 |
| Vs. State Violent Crime Rate |
|---|
| Year |
Murder, Man-Slaughter |
Forcible Rape |
Robbery |
Aggravated Assault |
| 2001 |
0 | 6 | 3 | 24 |
| 2002 |
2 | 8 | 10 | 30 |
| 2003 |
0 | 7 | 2 | 37 |
| 2004 |
0 | 6 | 5 | 35 |
| 2005 |
1 | 1 | 5 | 24 |
| 2006 |
2 | 8 | 4 | 24 |
| 2007 |
5 | 4 | 3 | 36 |
| 2008 |
0 | 2 | 13 | 39 |
| 2009 |
1 | 10 | 3 | 33 |
| 2010 |
0 | 4 | 6 | 33 |
Property Crime Reports
| Rate Per 100K People |
|---|
| 2001 | 1,433 |
| 2002 | 1,350 |
| 2003 | 1,466 |
| 2004 | 1,144 |
| 2005 | 1,064 |
| 2006 | 1,200 |
| 2007 | 909 |
| 2008 | 903 |
| 2009 | 790 |
| 2010 | 793 |
| Vs. State Property Crime Rate |
|---|
| Year |
Burglary |
Larceny, Theft |
Motor Vehicle Theft |
| 2001 |
195 |
523 |
25 |
| 2002 |
161 |
529 |
25 |
| 2003 |
179 |
667 |
27 |
| 2004 |
132 |
544 |
29 |
| 2005 |
104 |
524 |
45 |
| 2006 |
135 |
616 |
33 |
| 2007 |
114 |
467 |
39 |
| 2008 |
110 |
510 |
19 |
| 2009 |
121 |
425 |
20 |
| 2010 |
106 |
420 |
46 |
Location


