Grants Pass, OR Profile
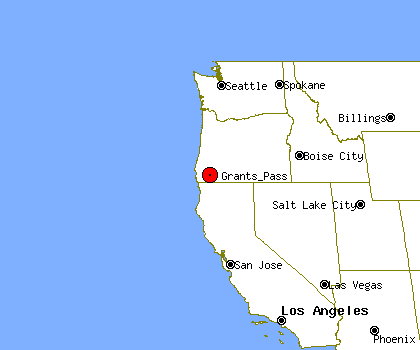
Grants Pass, OR, population 32,829, is located
in Oregon's Josephine county,
about 112.2 miles from Eugene and 173.8 miles from Salem.
Through the 90's Grants Pass's population has grown by about 32%.
It is estimated that in the first 5 years of the past decade the population of Grants Pass has grown by about 26%. Since 2005 Grants Pass's population has grown by about 3%.
Grants Pass's property crime levels tend to be higher than Oregon's average level.
The same data shows violent crime levels in Grants Pass tend to be lower than Oregon's average level.
Population Statistics
Gender
| Population by Gender |
|---|
| Males | 46% |
| Females | 54% |
Race
| Population by Race |
|---|
| White | 93% |
| African American | 0% |
| Native American | 1% |
| Asian | 1% |
| Hawaiian | 0% |
| Other/Mixed | 5% |
Age
| Median Age |
|---|
| Population | 9.99 |
| Males | 9.99 |
| Females | 9.99 |
| Males by Age | Females by Age |
|---|
| Under 20 | 9.99% | | Under 20: | 9.99% |
| 20 to 40 | 9.99% | | 20 to 40: | 9.99% |
| 40 to 60 | 9.99% | | 40 to 60: | 9.99% |
| Over 60 | 9.00% | | Over 60: | 9.99% |
Size
| Population by Year | Change Rate |
|---|
| 2000 | 29,340 | N/A |
| 2001 | 29,680 | 1.16% |
| 2002 | 30,206 | 1.77% |
| 2003 | 30,748 | 1.79% |
| 2004 | 31,342 | 1.93% |
| 2005 | 31,749 | 1.30% |
| 2006 | 32,441 | 2.18% |
| 2007 | 32,511 | 0.22% |
| 2008 | 32,843 | 1.02% |
| 2009 | 32,829 | -0.04% |
Economics
| Household Income |
|---|
| Median | $29,197 |
Law Enforcement Statistics
Violent Crime Reports
| Rate Per 100K People |
|---|
| 2001 | 270 |
| 2002 | 287 |
| 2003 | 207 |
| 2004 | 262 |
| 2005 | 134 |
| 2006 | 167 |
| 2007 | 221 |
| 2008 | 172 |
| 2009 | N/A |
| 2010 | N/A |
| Vs. State Violent Crime Rate |
|---|
| Year |
Murder, Man-Slaughter |
Forcible Rape |
Robbery |
Aggravated Assault |
| 2001 |
1 | 1 | 29 | 32 |
| 2002 |
0 | 9 | 26 | 33 |
| 2003 |
0 | 12 | 24 | 16 |
| 2004 |
2 | 14 | 32 | 20 |
| 2005 |
2 | 10 | 14 | 11 |
| 2006 |
0 | 16 | 13 | 20 |
| 2007 |
3 | 14 | 21 | 29 |
| 2008 |
0 | 8 | 28 | 22 |
| 2009 |
- | - | - | - |
| 2010 |
- | - | - | - |
Property Crime Reports
| Rate Per 100K People |
|---|
| 2001 | 6,373 |
| 2002 | 6,517 |
| 2003 | 7,299 |
| 2004 | 7,228 |
| 2005 | 6,324 |
| 2006 | 6,333 |
| 2007 | 5,503 |
| 2008 | 5,455 |
| 2009 | N/A |
| 2010 | N/A |
| Vs. State Property Crime Rate |
|---|
| Year |
Burglary |
Larceny, Theft |
Motor Vehicle Theft |
| 2001 |
181 |
1,225 |
82 |
| 2002 |
212 |
1,233 |
98 |
| 2003 |
226 |
1,448 |
159 |
| 2004 |
264 |
1,482 |
130 |
| 2005 |
140 |
1,459 |
143 |
| 2006 |
177 |
1557 |
125 |
| 2007 |
185 |
1328 |
154 |
| 2008 |
256 |
1460 |
121 |
| 2009 |
- |
- |
- |
| 2010 |
- |
- |
- |
Location
| Elevation | 948 feet above sea level |
| Land Area | 6.5 Square Miles |
| Water Area | 0.1 Square Miles |


