Washington, DC Profile
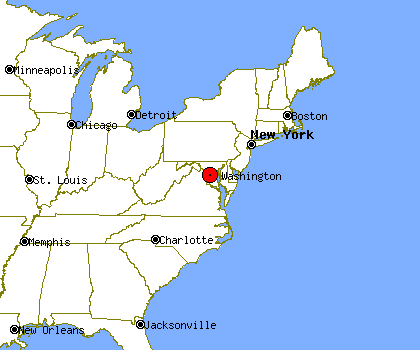
Washington, DC, population 599,657, is located
about 2.6 miles from Arlington and 6.3 miles from Alexandria.
Through the 90's Washington's population has declined by about 6%.
It is estimated that in the first 5 years of the past decade the population of Washington has declined by about 4%. Since 2005 Washington's population has grown by about 3%.
Population Statistics
Gender
| Population by Gender |
|---|
| Males | 47% |
| Females | 53% |
Race
| Population by Race |
|---|
| White | 31% |
| African American | 60% |
| Native American | 0% |
| Asian | 3% |
| Hawaiian | 0% |
| Other/Mixed | 6% |
Age
| Median Age |
|---|
| Population | 9.99 |
| Males | 9.99 |
| Females | 9.99 |
| Males by Age | Females by Age |
|---|
| Under 20 | 9.99% | | Under 20: | 9.99% |
| 20 to 40 | 9.99% | | 20 to 40: | 9.99% |
| 40 to 60 | 9.99% | | 40 to 60: | 9.99% |
| Over 60 | 6.00% | | Over 60: | 9.99% |
Size
| Population by Year | Change Rate |
|---|
| 2000 | 572,055 | N/A |
| 2001 | 578,042 | 1.05% |
| 2002 | 579,585 | 0.27% |
| 2003 | 577,777 | -0.31% |
| 2004 | 579,796 | 0.35% |
| 2005 | 582,049 | 0.39% |
| 2006 | 583,978 | 0.33% |
| 2007 | 586,409 | 0.42% |
| 2008 | 590,074 | 0.62% |
| 2009 | 599,657 | 1.62% |
Economics
| Household Income |
|---|
| Median | $40,127 |
Law Enforcement Statistics
Violent Crime Reports
| Rate Per 100K People |
|---|
| 2001 | 1,736 |
| 2002 | 1,596 |
| 2003 | 1,569 |
| 2004 | 1,325 |
| 2005 | 1,402 |
| 2006 | 1,446 |
| 2007 | 1,347 |
| 2008 | 1,375 |
| 2009 | 1,265 |
| 2010 | 1,241 |
| Vs. State Violent Crime Rate |
|---|
| Year |
Murder, Man-Slaughter |
Forcible Rape |
Robbery |
Aggravated Assault |
| 2001 |
232 | 188 | 3,940 | 5,568 |
| 2002 |
264 | 262 | 3,731 | 4,854 |
| 2003 |
248 | 273 | 3,836 | 4,482 |
| 2004 |
198 | 218 | 3,057 | 3,863 |
| 2005 |
195 | 165 | 3,502 | 3,854 |
| 2006 |
169 | 182 | 3604 | 4453 |
| 2007 |
181 | 192 | 3985 | 3566 |
| 2008 |
186 | 186 | 4154 | 3609 |
| 2009 |
143 | 150 | 3998 | 3295 |
| 2010 |
132 | 184 | 3914 | 3238 |
Property Crime Reports
| Rate Per 100K People |
|---|
| 2001 | 5,966 |
| 2002 | 6,172 |
| 2003 | 5,606 |
| 2004 | 4,667 |
| 2005 | 4,577 |
| 2006 | 4,474 |
| 2007 | 4,712 |
| 2008 | 4,859 |
| 2009 | 4,504 |
| 2010 | 4,510 |
| Vs. State Property Crime Rate |
|---|
| Year |
Burglary |
Larceny, Theft |
Motor Vehicle Theft |
| 2001 |
5,009 |
21,434 |
7,670 |
| 2002 |
5,167 |
20,903 |
9,168 |
| 2003 |
4,670 |
17,362 |
9,549 |
| 2004 |
3,943 |
13,756 |
8,136 |
| 2005 |
3,571 |
14,162 |
7,467 |
| 2006 |
3826 |
15132 |
7057 |
| 2007 |
3920 |
16476 |
7323 |
| 2008 |
3781 |
18787 |
6191 |
| 2009 |
3696 |
18012 |
5299 |
| 2010 |
4224 |
18050 |
4864 |
Location
| Elevation | 18 feet above sea level |
| Land Area | 61.4 Square Miles |
| Water Area | 6.9 Square Miles |


