Rancho Santa Margarita, CA Profile
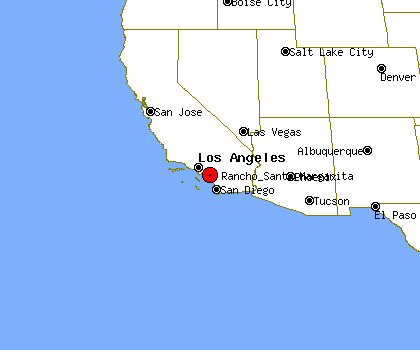
Rancho Santa Margarita, CA, population 49,458, is located
in California's Orange county,
about 12.8 miles from Irvine and 16.4 miles from Corona.
Through the 90's Rancho Santa Margarita's population has grown by about 315%.
It is estimated that in the first 5 years of the past decade the population of Rancho Santa Margarita has grown by about 7%. Since 2005 Rancho Santa Margarita's population has stayed about the same.
Rancho Santa Margarita's property crime levels tend to be much lower than
California's average level.
The same data shows violent crime levels in Rancho Santa Margarita tend to be much lower than California's average level.
Population Statistics
Gender
| Population by Gender |
|---|
| Males | 49% |
| Females | 51% |
Race
| Population by Race |
|---|
| White | 82% |
| African American | 2% |
| Native American | 0% |
| Asian | 7% |
| Hawaiian | 0% |
| Other/Mixed | 9% |
Age
| Median Age |
|---|
| Population | 9.99 |
| Males | 9.99 |
| Females | 9.99 |
| Males by Age | Females by Age |
|---|
| Under 20 | 9.99% | | Under 20: | 9.99% |
| 20 to 40 | 9.99% | | 20 to 40: | 9.99% |
| 40 to 60 | 9.99% | | 40 to 60: | 9.99% |
| Over 60 | 2.00% | | Over 60: | 3.00% |
Size
| Population by Year | Change Rate |
|---|
| 2000 | 46,974 | N/A |
| 2001 | 47,224 | 0.53% |
| 2002 | 47,508 | 0.60% |
| 2003 | 48,609 | 2.32% |
| 2004 | 49,143 | 1.10% |
| 2005 | 49,260 | 0.24% |
| 2006 | 48,909 | -0.71% |
| 2007 | 48,667 | -0.49% |
| 2008 | 48,920 | 0.52% |
| 2009 | 49,458 | 1.10% |
Economics
| Household Income |
|---|
| Median | $78,475 |
Law Enforcement Statistics
Violent Crime Reports
| Rate Per 100K People |
|---|
| 2001 | 131 |
| 2002 | 67 |
| 2003 | 70 |
| 2004 | 87 |
| 2005 | 64 |
| 2006 | 68 |
| 2007 | 59 |
| 2008 | 52 |
| 2009 | 46 |
| 2010 | N/A |
| Vs. State Violent Crime Rate |
|---|
| Year |
Murder, Man-Slaughter |
Forcible Rape |
Robbery |
Aggravated Assault |
| 2001 |
0 | 4 | 8 | 51 |
| 2002 |
0 | 7 | 5 | 21 |
| 2003 |
0 | 1 | 6 | 27 |
| 2004 |
1 | 0 | 6 | 36 |
| 2005 |
0 | 0 | 7 | 25 |
| 2006 |
0 | 3 | 9 | 23 |
| 2007 |
0 | 2 | 8 | 20 |
| 2008 |
0 | 2 | 6 | 18 |
| 2009 |
0 | 2 | 6 | 15 |
| 2010 |
- | - | - | - |
Property Crime Reports
| Rate Per 100K People |
|---|
| 2001 | 932 |
| 2002 | 1,079 |
| 2003 | 978 |
| 2004 | 988 |
| 2005 | 900 |
| 2006 | 907 |
| 2007 | 1,054 |
| 2008 | 1,065 |
| 2009 | 812 |
| 2010 | N/A |
| Vs. State Property Crime Rate |
|---|
| Year |
Burglary |
Larceny, Theft |
Motor Vehicle Theft |
| 2001 |
71 |
338 |
39 |
| 2002 |
103 |
385 |
40 |
| 2003 |
78 |
355 |
43 |
| 2004 |
89 |
372 |
30 |
| 2005 |
80 |
342 |
31 |
| 2006 |
78 |
360 |
26 |
| 2007 |
103 |
395 |
40 |
| 2008 |
96 |
413 |
23 |
| 2009 |
71 |
319 |
15 |
| 2010 |
- |
- |
- |
Location
| Elevation | 950 feet above sea level |
| Land Area | 4.2 Square Miles |


