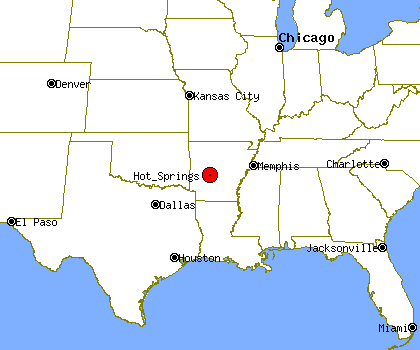
Hot Springs, AR Profile
Hot Springs, AR, population 39,676, is located
in Arkansas's Garland county,
about 46.7 miles from Little Rock and 142.6 miles from Shreveport.
It is estimated that in the first 5 years of the past decade the population of Hot Springs has grown by about 6%. Since 2005 Hot Springs's population has grown by about 5%.
Hot Springs's property crime levels tend to be much higher than
Arkansas's average level.
The same data shows violent crime levels in Hot Springs tend to be much higher than Arkansas's average level.
Population Statistics
Gender
| Population by Gender |
|---|
| Males | 47% |
| Females | 53% |
Race
| Population by Race |
|---|
| White | 79% |
| African American | 17% |
| Native American | 1% |
| Asian | 1% |
| Hawaiian | 0% |
| Other/Mixed | 2% |
Age
| Median Age |
|---|
| Population | 9.99 |
| Males | 9.99 |
| Females | 9.99 |
| Males by Age | Females by Age |
|---|
| Under 20 | 9.99% | | Under 20: | 9.99% |
| 20 to 40 | 9.99% | | 20 to 40: | 9.99% |
| 40 to 60 | 9.99% | | 40 to 60: | 9.99% |
| Over 60 | 9.99% | | Over 60: | 9.99% |
Size
| Population by Year | Change Rate |
|---|
| 2000 | 35,966 | N/A |
| 2001 | 36,290 | 0.90% |
| 2002 | 36,550 | 0.72% |
| 2003 | 36,936 | 1.06% |
| 2004 | 37,239 | 0.82% |
| 2005 | 37,754 | 1.38% |
| 2006 | 38,513 | 2.01% |
| 2007 | 38,918 | 1.05% |
| 2008 | 39,373 | 1.17% |
| 2009 | 39,676 | 0.77% |
Economics
| Household Income |
|---|
| Median | $26,040 |
Law Enforcement Statistics
Violent Crime Reports
| Rate Per 100K People |
|---|
| 2001 | N/A |
| 2002 | N/A |
| 2003 | 1,072 |
| 2004 | 1,190 |
| 2005 | 1,319 |
| 2006 | 1,335 |
| 2007 | 1,138 |
| 2008 | 1,300 |
| 2009 | 1,199 |
| 2010 | 1,003 |
| Vs. State Violent Crime Rate |
|---|
| Year |
Murder, Man-Slaughter |
Forcible Rape |
Robbery |
Aggravated Assault |
| 2001 |
- | - | - | - |
| 2002 |
- | - | - | - |
| 2003 |
3 | 18 | 80 | 291 |
| 2004 |
7 | 17 | 90 | 328 |
| 2005 |
4 | 26 | 87 | 379 |
| 2006 |
4 | 23 | 133 | 351 |
| 2007 |
7 | 10 | 116 | 309 |
| 2008 |
1 | 19 | 104 | 389 |
| 2009 |
5 | 21 | 121 | 331 |
| 2010 |
7 | 22 | 72 | 301 |
Property Crime Reports
| Rate Per 100K People |
|---|
| 2001 | N/A |
| 2002 | N/A |
| 2003 | 12,008 |
| 2004 | 13,392 |
| 2005 | 12,041 |
| 2006 | 12,054 |
| 2007 | 10,176 |
| 2008 | 9,941 |
| 2009 | 9,339 |
| 2010 | 7,794 |
| Vs. State Property Crime Rate |
|---|
| Year |
Burglary |
Larceny, Theft |
Motor Vehicle Theft |
| 2001 |
- |
- |
- |
| 2002 |
- |
- |
- |
| 2003 |
915 |
3,246 |
230 |
| 2004 |
1,311 |
3,361 |
301 |
| 2005 |
894 |
3,348 |
286 |
| 2006 |
1162 |
3215 |
237 |
| 2007 |
848 |
2894 |
209 |
| 2008 |
737 |
2996 |
189 |
| 2009 |
889 |
2644 |
190 |
| 2010 |
793 |
2161 |
170 |
Location
| Elevation | 632 feet above sea level |


