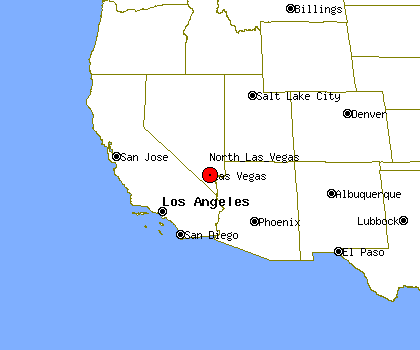
North Las Vegas, NV Profile
North Las Vegas, NV, population 224,387, is located
in Nevada's Clark county,
about 2.0 miles from Las Vegas and 2.6 miles from Sunrise Manor.
Through the 90's North Las Vegas's population has grown by about 142%.
It is estimated that in the first 5 years of the past decade the population of North Las Vegas has grown by about 53%. Since 2005 North Las Vegas's population has grown by about 27%.
North Las Vegas's property crime levels tend to be about the same as
Nevada's average level.
The same data shows violent crime levels in North Las Vegas tend to be higher than Nevada's average level.
Population Statistics
Gender
| Population by Gender |
|---|
| Males | 51% |
| Females | 49% |
Race
| Population by Race |
|---|
| White | 56% |
| African American | 19% |
| Native American | 1% |
| Asian | 3% |
| Hawaiian | 1% |
| Other/Mixed | 20% |
Age
| Median Age |
|---|
| Population | 9.99 |
| Males | 9.99 |
| Females | 9.99 |
| Males by Age | Females by Age |
|---|
| Under 20 | 9.99% | | Under 20: | 9.99% |
| 20 to 40 | 9.99% | | 20 to 40: | 9.99% |
| 40 to 60 | 9.99% | | 40 to 60: | 9.99% |
| Over 60 | 4.00% | | Over 60: | 5.00% |
Size
| Population by Year | Change Rate |
|---|
| 2000 | 115,531 | N/A |
| 2001 | 127,181 | 9.99% |
| 2002 | 135,363 | 6.43% |
| 2003 | 144,224 | 6.55% |
| 2004 | 158,235 | 9.71% |
| 2005 | 176,250 | 9.99% |
| 2006 | 197,160 | 9.99% |
| 2007 | 211,612 | 7.33% |
| 2008 | 217,975 | 3.01% |
| 2009 | 224,387 | 2.94% |
Economics
| Household Income |
|---|
| Median | $46,057 |
Law Enforcement Statistics
Violent Crime Reports
| Rate Per 100K People |
|---|
| 2001 | 1,112 |
| 2002 | 1,030 |
| 2003 | 826 |
| 2004 | 695 |
| 2005 | 826 |
| 2006 | 929 |
| 2007 | 841 |
| 2008 | 709 |
| 2009 | 717 |
| 2010 | N/A |
| Vs. State Violent Crime Rate |
|---|
| Year |
Murder, Man-Slaughter |
Forcible Rape |
Robbery |
Aggravated Assault |
| 2001 |
20 | 50 | 433 | 850 |
| 2002 |
19 | 57 | 449 | 769 |
| 2003 |
18 | 48 | 332 | 760 |
| 2004 |
14 | 58 | 371 | 603 |
| 2005 |
20 | 56 | 408 | 872 |
| 2006 |
22 | 57 | 584 | 1032 |
| 2007 |
28 | 53 | 645 | 1051 |
| 2008 |
11 | 57 | 554 | 998 |
| 2009 |
17 | 51 | 587 | 1013 |
| 2010 |
- | - | - | - |
Property Crime Reports
| Rate Per 100K People |
|---|
| 2001 | 4,489 |
| 2002 | 4,835 |
| 2003 | 4,360 |
| 2004 | 4,267 |
| 2005 | 4,617 |
| 2006 | 4,721 |
| 2007 | 3,876 |
| 2008 | 3,247 |
| 2009 | 2,801 |
| 2010 | N/A |
| Vs. State Property Crime Rate |
|---|
| Year |
Burglary |
Larceny, Theft |
Motor Vehicle Theft |
| 2001 |
1,336 |
2,824 |
1,304 |
| 2002 |
1,525 |
3,029 |
1,519 |
| 2003 |
1,642 |
2,687 |
1,781 |
| 2004 |
1,507 |
2,934 |
1,982 |
| 2005 |
1,866 |
3,249 |
2,466 |
| 2006 |
2523 |
3456 |
2638 |
| 2007 |
2334 |
3631 |
2230 |
| 2008 |
2208 |
3591 |
1617 |
| 2009 |
1913 |
3436 |
1166 |
| 2010 |
- |
- |
- |
Location
| Elevation | 1,845 feet above sea level |
| Land Area | 61 Square Miles |


